
Groundwater levels in good shape from wet October
at

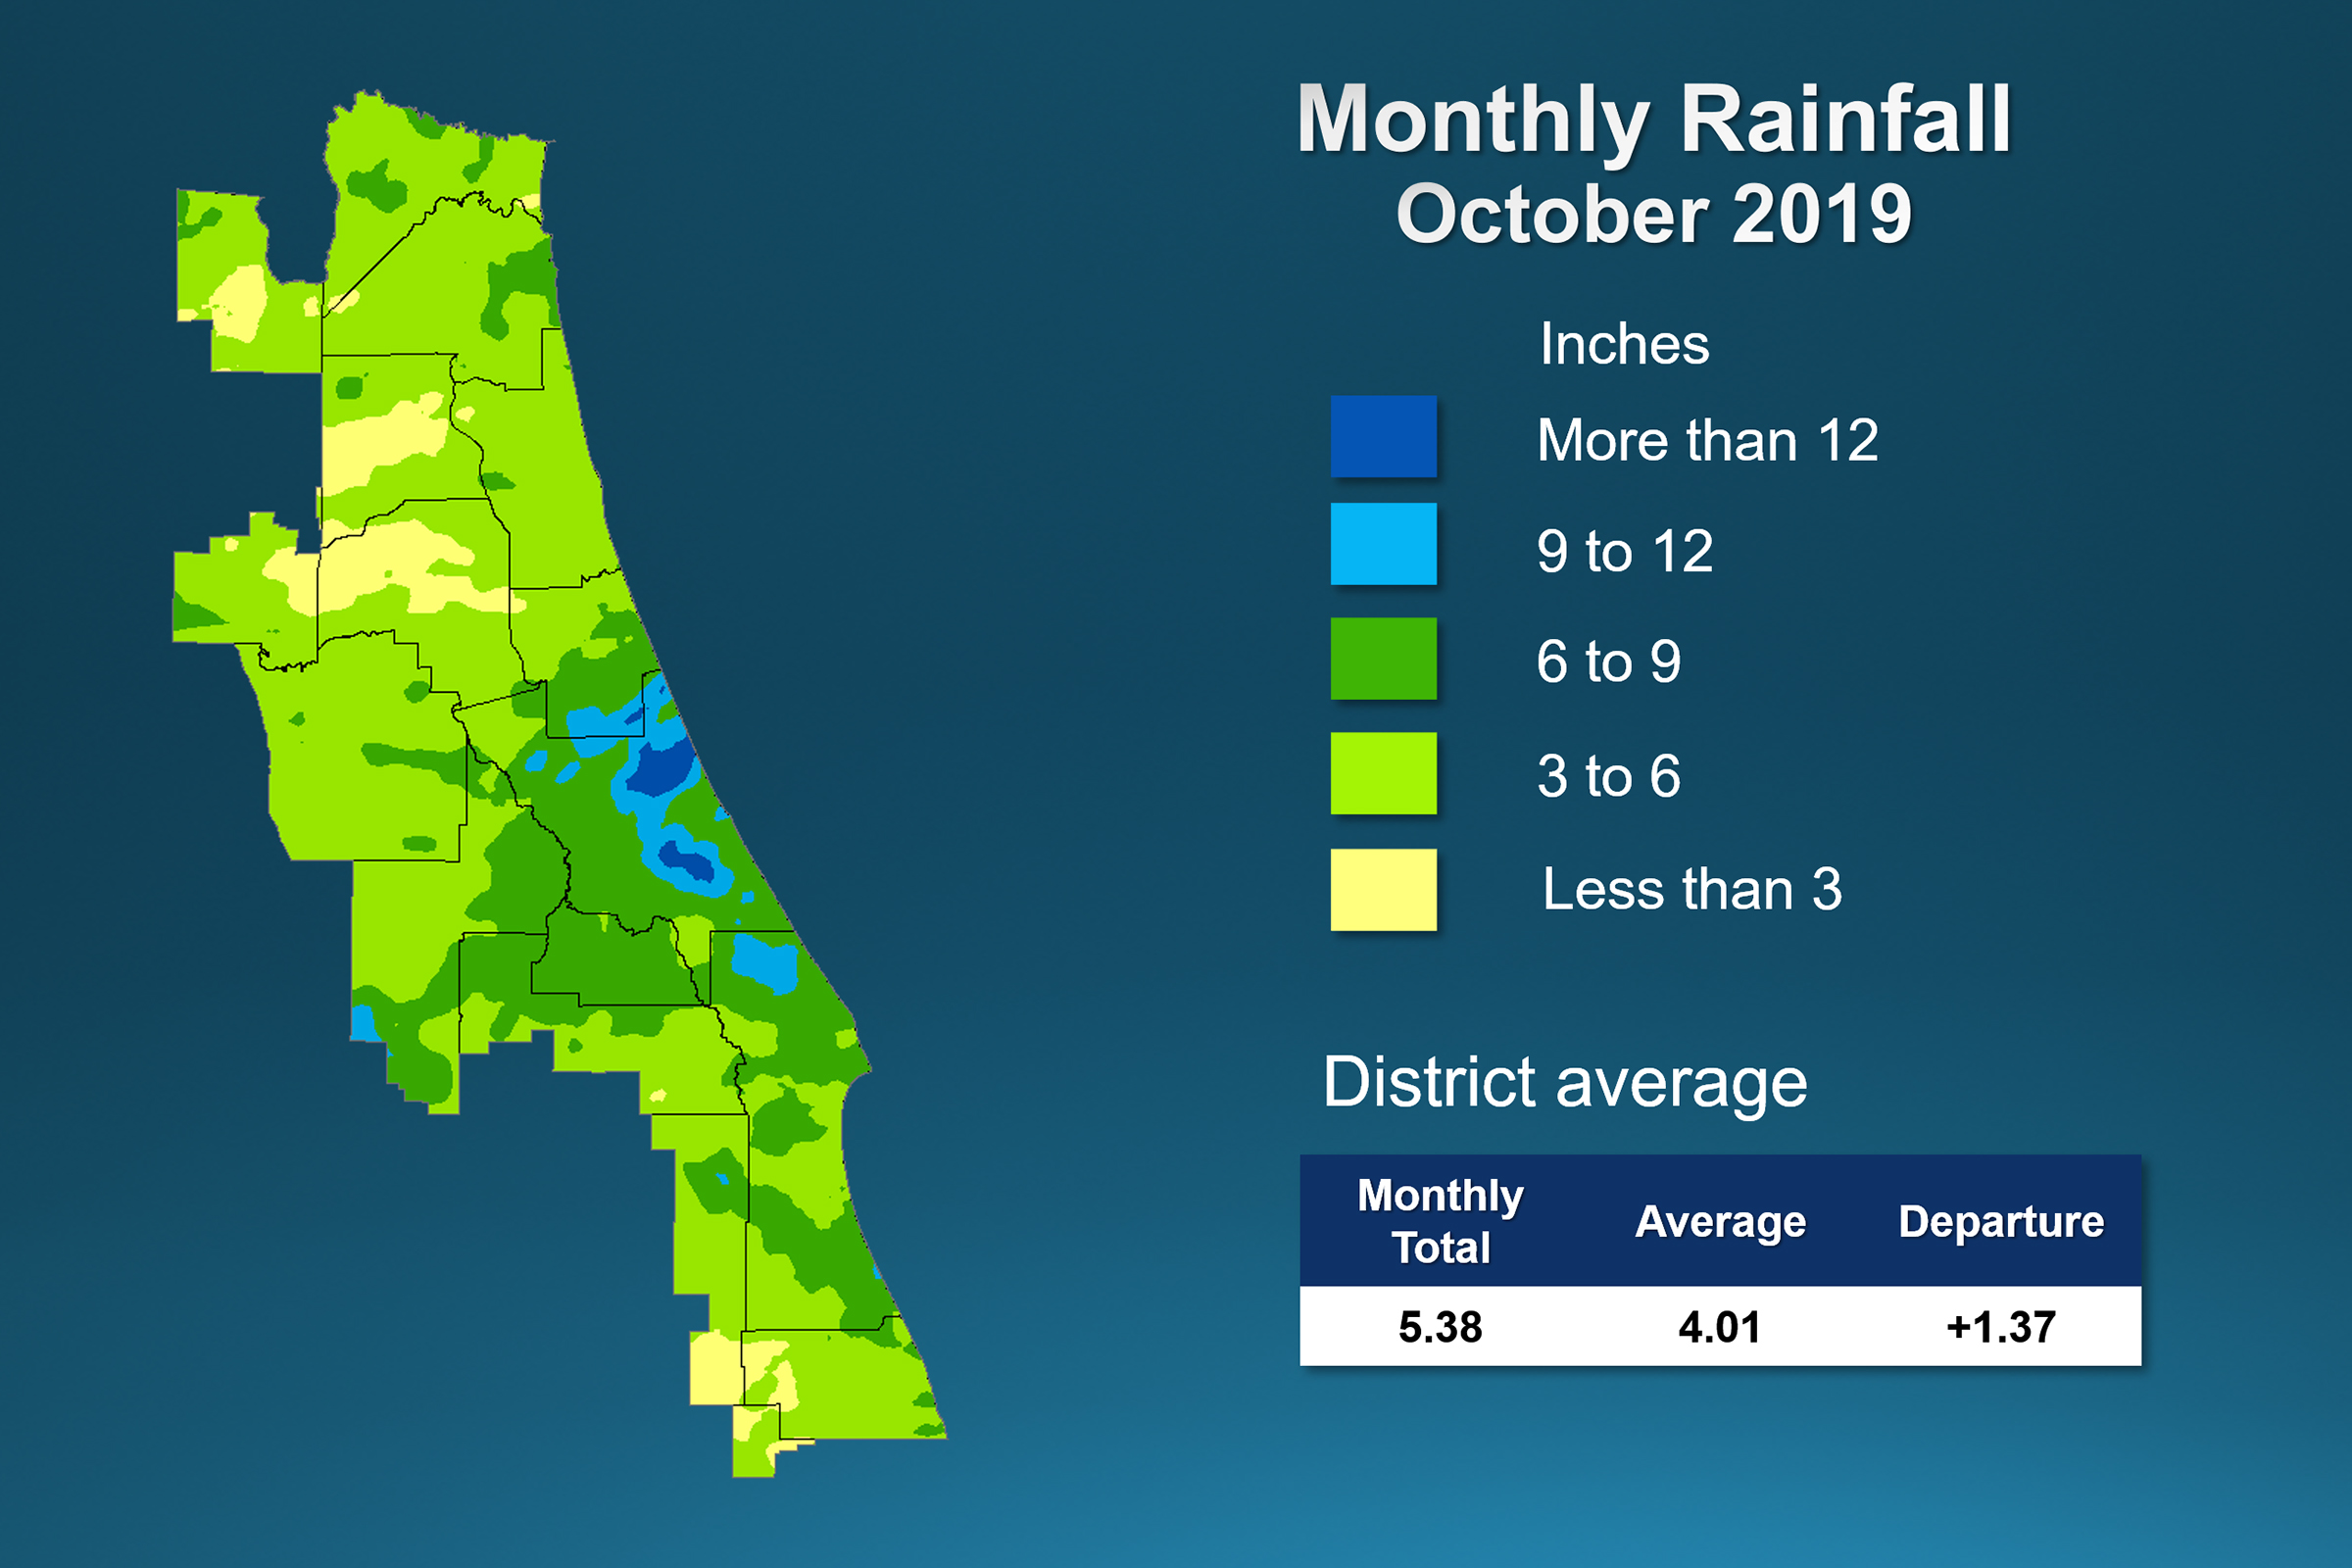
A map illustrates rainfall conditions in October across the St. Johns River Water Management District.
Drought conditions lingering in Baker and Nassau counties
PALATKA, Fla., Nov. 12, 2019 — After a dry September, October brought rain across most of the 18 counties of the St. Johns River Water Management District, keeping groundwater levels in the Floridan aquifer high.
A full report outlining hydrological conditions was presented at the District’s November Governing Board meeting. Highlights included:
Rainfall
- Most of the District received average or above-average rainfall in October, with a zone of very high rainfall in southern Flagler, Volusia, Seminole and northern Brevard counties. Some areas of Volusia County received more than a foot of rain in October, though the countywide average was just over 8 inches.
- Rainfall in the northern and western portions of the District was average.
- Putnam, Clay, Baker and Alachua counties all received between 3.5 and 4 inches of rain for the month.
- Districtwide, the cumulative rainfall total over the last 12 months is 50.6 inches, just below the long-term average of 51 inches.
- Marion County is still above average for the past 12 months, with a total of 60.4 inches of rainfall.
- The southernmost and northernmost counties have 12-month deficits — Indian River County has received just 43.4 inches of rain over the last 12 months, while Nassau County has received 43.9 inches of rain.
Groundwater
- Upper Floridan aquifer conditions (groundwater levels) were in the normal to high range across the District.
- However, water levels in many northern District monitoring wells and in some southern wells dropped significantly.
- Groundwater levels are in the 81st percentile Districtwide. This means that only 19 percent of the time since 1980 have aquifer levels been higher than they are now.
Surface water flows
- Surface water flows on Nov. 1 in Orlando-area tributaries responded to October’s high rainfall: the Wekiva and Econ rivers rose into the high range.
- Also in the central region, the middle St. Johns River and Ocklawaha River were in the average range.
- On opposite ends of the District, surface water flows in the Upper St. Johns River Basin and St. Marys River, were in the low range on Nov. 1.
Lake levels
- During October, water levels in Lake Brooklyn decreased by 0.5 feet.
- Lakes Weir and Winnemissett had small increases.
- Lake Apopka’s water level increased 0.5 feet and is at regulation schedule.
- Blue Cypress Lake decreased slightly and is below regulation level.
Spring flows
- Flow at Silver Springs decreased to 696 cubic feet per second (cfs), or 450 million gallons of water per day (mgd), in October.
- Rock Springs was in the normal or high range with a mean monthly flow of 60 cfs (39 mgd)
- Volusia Blue Spring increased by 0.5 cfs but remained very low with a monthly mean of 103 cfs (67 mgd).
- Flow at Wekiwa Springs decreased by 2 cfs but ended October in the normal range with mean flow of 70 cfs (45 mgd).
To learn more about rainfall totals and other hydrologic data collected, visit www.sjrwmd.com.