
Dry January adds to 12-month rainfall deficit
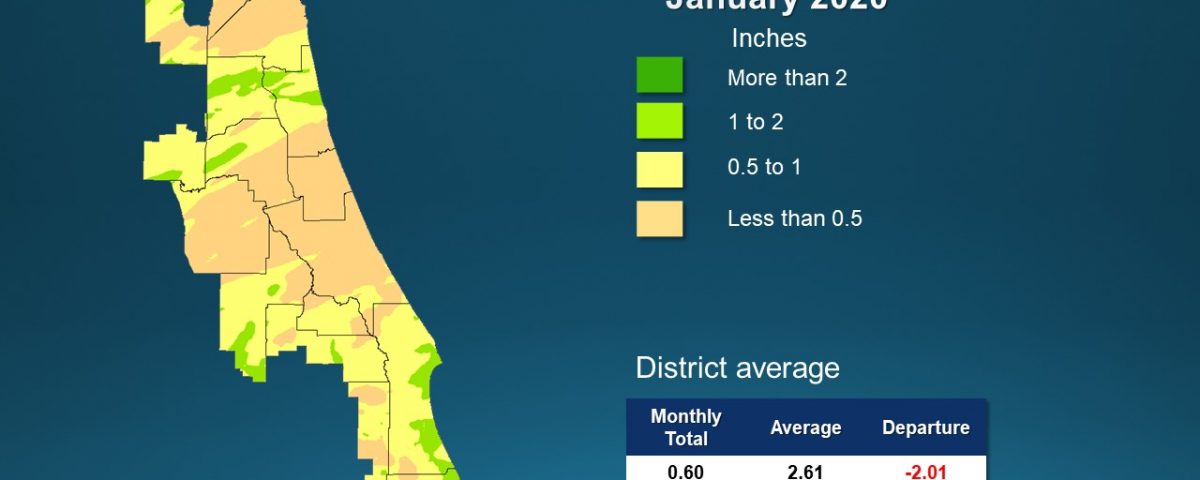
A map illustrates rainfall conditions in January across the St. Johns River Water Management District.
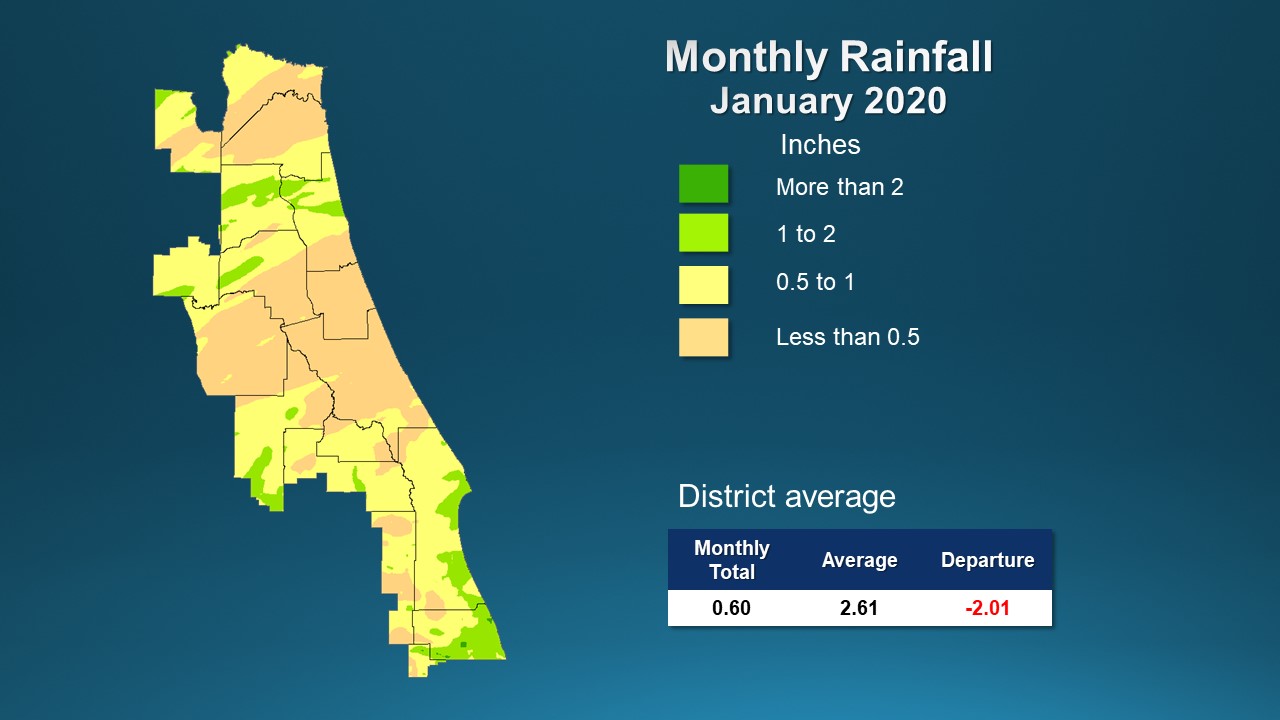
A map illustrates rainfall conditions in January across the St. Johns River Water Management District.
PALATKA, Fla., Feb. 13, 2020 — January kicked off the year with below-average rainfall across the entire 18-county St. Johns River Water Management District, adding to a rainfall deficit for the past 12 months.
A full report outlining hydrological conditions was presented at the District’s February Governing Board meeting. Highlights included:
Rainfall
- January rainfall was well below average across the District, with a Districtwide total of 0.6 inch, which is more than 2 inches below the long-term average.
- Flagler County received the least rainfall, with 0.3 inch, while Indian River County had the most rainfall, still with only an inch of rain.
- Baker, Clay, Duval and Putnam counties led the District with the greatest deficits for the 12-month period and are more than 11 inches below the long-term average.
- Districtwide, the cumulative rainfall total over the last 12 months is 45.6 inches, which is 5.4 inches below the long-term average.
- Counties with zones that are above the long-term rainfall average are Brevard, Seminole, Marion, Volusia and Osceola.
Groundwater
- Upper Floridan aquifer conditions (groundwater levels) at the end of January were in the normal or high range across the District, though data show declining water levels in some central and coastal monitoring wells.
- Groundwater levels are at the 78th percentile Districtwide. This means that only 22 percent of the time since 1980 have aquifer levels been higher than they are now.
Surface water flows
- Surface water flow conditions across the District were in the average range for this time of year, other than the Wekiva River and the St. Johns River near Satsuma, which were in the low range.
- Flow in the St. Johns River’s headwaters near Melbourne was 125 million gallons per day (MGD) and increased downstream to DeLand where flow was 1.2 billion gallons per day (BGD).
Lake levels
- Lake Brooklyn water level decreased 0.6 feet but remains above the long-term average.
- Lake Weir decreased 0.2 feet.
- Lake Winnemissett levels decreased 0.3 feet.
- Lake Apopka’s water level decreased and is now at regulation schedule.
- Blue Cypress Lake levels decreased 0.2 feet, remaining below both the average and its regulation level for this time of year.
Spring flows
- The mean monthly flow at Silver Springs was 739 cubic feet per second (cfs) or 477 MGD with daily flow conditions in the high range throughout the month.
- Flow in Volusia Blue Spring decreased during January, with a monthly mean of 136 cfs.
- Flow at Rock Springs and Wekiwa Springs maintained mean monthly flows of 62 cfs and 69 cfs, respectively.
To learn more about rainfall totals and other hydrologic data collected, visit sjrwmd.com.
Visit the District’s Water Less campaign webpage at waterlessflorida.com and follow the District on social media to learn ways to conserve water outdoors.