
Improved rainfall in May was good start to Florida’s rainy season
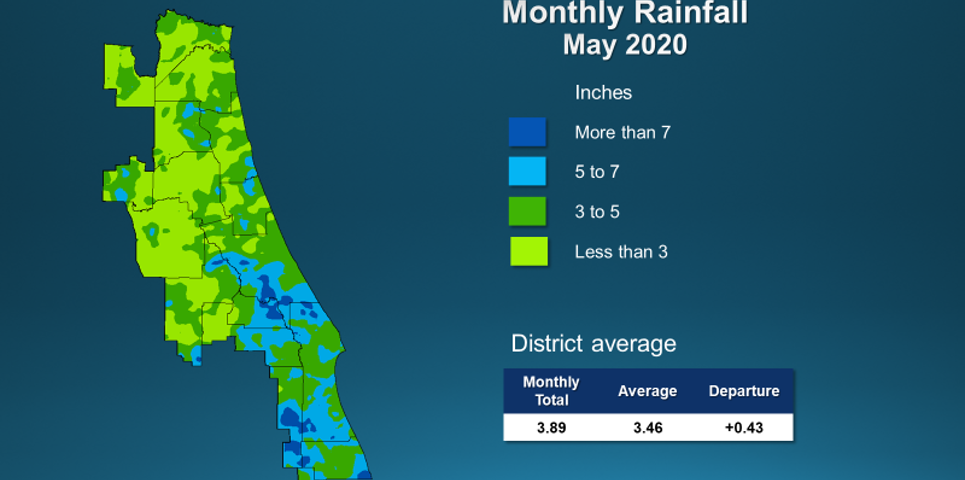
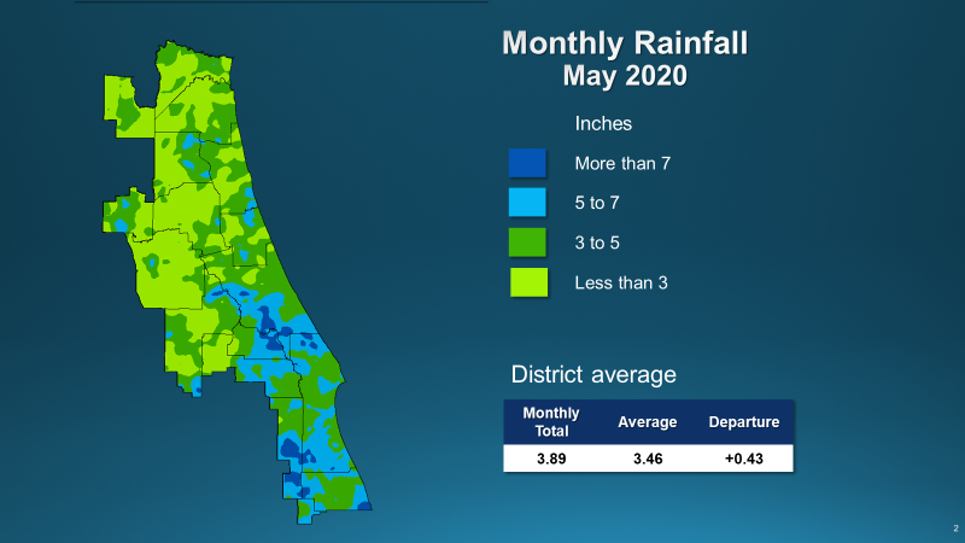
A map illustrates rainfall conditions in May across the St. Johns River Water Management District.
PALATKA, Fla., June 9, 2020 — After a slow start, Florida’s rainy season kicked off in mid to late May, which rounded out the month with above-average rainfall. A full report outlining hydrological conditions was presented at the District’s June Governing Board online teleconference.
A map illustrates rainfall conditions in May across the St. Johns River Water Management District.
Highlights included:
Rainfall
- May rainfall averaged 3.46 inches Districtwide, which is nearly a half-inch above the long-term average for the month.
- The District’s western and northern counties received below-average rainfall while central and southern counties received well-above average rainfall.
- Putnam, Baker and Marion counties received less than 3 inches of rain.
- Osceola, Indian River and Brevard received 5 or more inches of rain.
- Districtwide, the cumulative rainfall total over the last 12 months is 47.8 inches, which is 3.3 inches below the long-term average.
- Counties with the greatest rainfall deficit through May were Putnam, Flagler and St. Johns counties, which have a 12-month rainfall deficit of more than 10 inches.
- May rainfall helped lift Volusia, Brevard and Seminole counties above the long-term average rainfall.
Groundwater
- Upper Floridan aquifer conditions (groundwater levels) at the end of May were mostly in the normal range throughout most of the District, other than areas of low and very low conditions in the coastal and central portions of the District.
- Groundwater levels are at the 39th percentile Districtwide, which means that since 1980, about 61 percent of the time aquifer levels have been higher than they are now.
- Dry conditions earlier in the month resulted in greater irrigation demands, and water levels in many monitoring wells decreased by 10 percent compared to the end of April. The downward trend is expected to reverse with the rainy conditions occurring in early June.
- The District’s summertime water conservation message reminds water users to “Watch the Weather. Wait to Water.”
Surface water flows
- Surface water flow conditions in the St. Johns River’s headwaters rose to the average range for this time of year.
- Flow conditions in central Florida were in the average range, with the DeLand station reporting 799 mgd on June 1 and 3.4 billion gallons per day (bgd) at the Satsuma station.
- Flow in the headwaters at the Melbourne station was 64 mgd.
- Flow in the Ocklawaha River remained in the low range at 401 mgd.
Lake levels
- Lake Brooklyn water levels decreased 1 foot and is below its the long-term average level for May.
- Lake Weir decreased 0.3 foot during May.
- Lake Winnemissett levels decreased 0.2 foot.
- Lake Apopka’s water level decreased 0.3 foot and remained below its regulation schedule for May.
- Blue Cypress Lake levels increased 0.1 foot and is near its long-term average. Keeping water levels low in the Upper St. Johns River Basin helps the District prepare for greater rainfall during the tropical season.
Spring flows
- The mean monthly flow at Silver Springs decreased to 611 cubic feet per second (cfs) or 395 mgd, in May.
- Flow in Volusia Blue Spring decreased during May, with a monthly mean of 141 cfs, a decrease of 10 cfs from the April report.
- Flows at Rock Springs and Wekiwa Springs decreased very slightly, with mean monthly flows of 56 cfs and 63 cfs, respectively.
To learn more about rainfall totals and other hydrologic data collected, visit sjrwmd.com.
Visit the District’s Water Less campaign webpage at WaterLessFlorida.com and follow the District on social media to learn ways to conserve water outdoors. #WaterLessFlorida #waterconservation #sjrwmd