
Annual report shows 9% decrease in water use over last decade
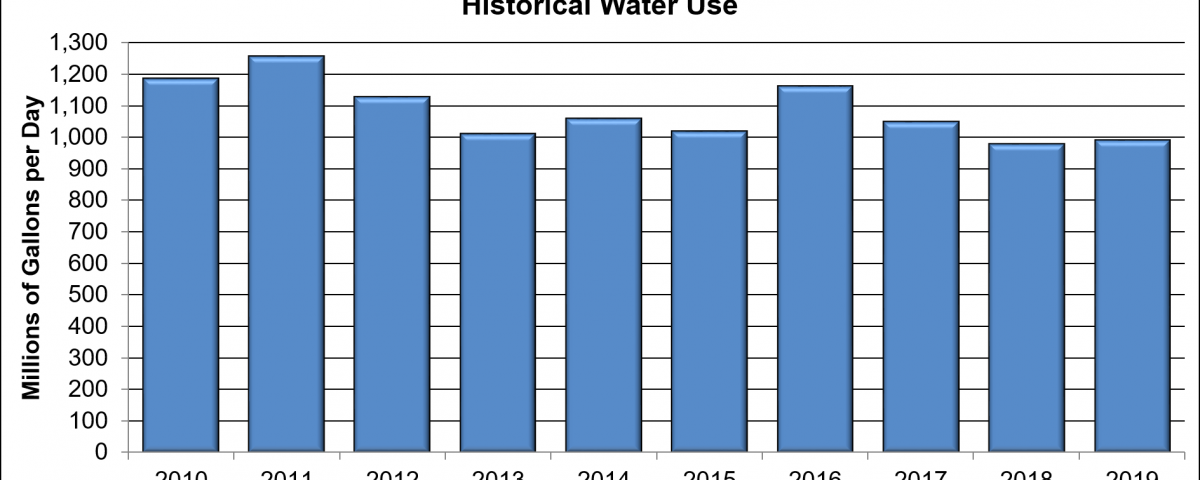
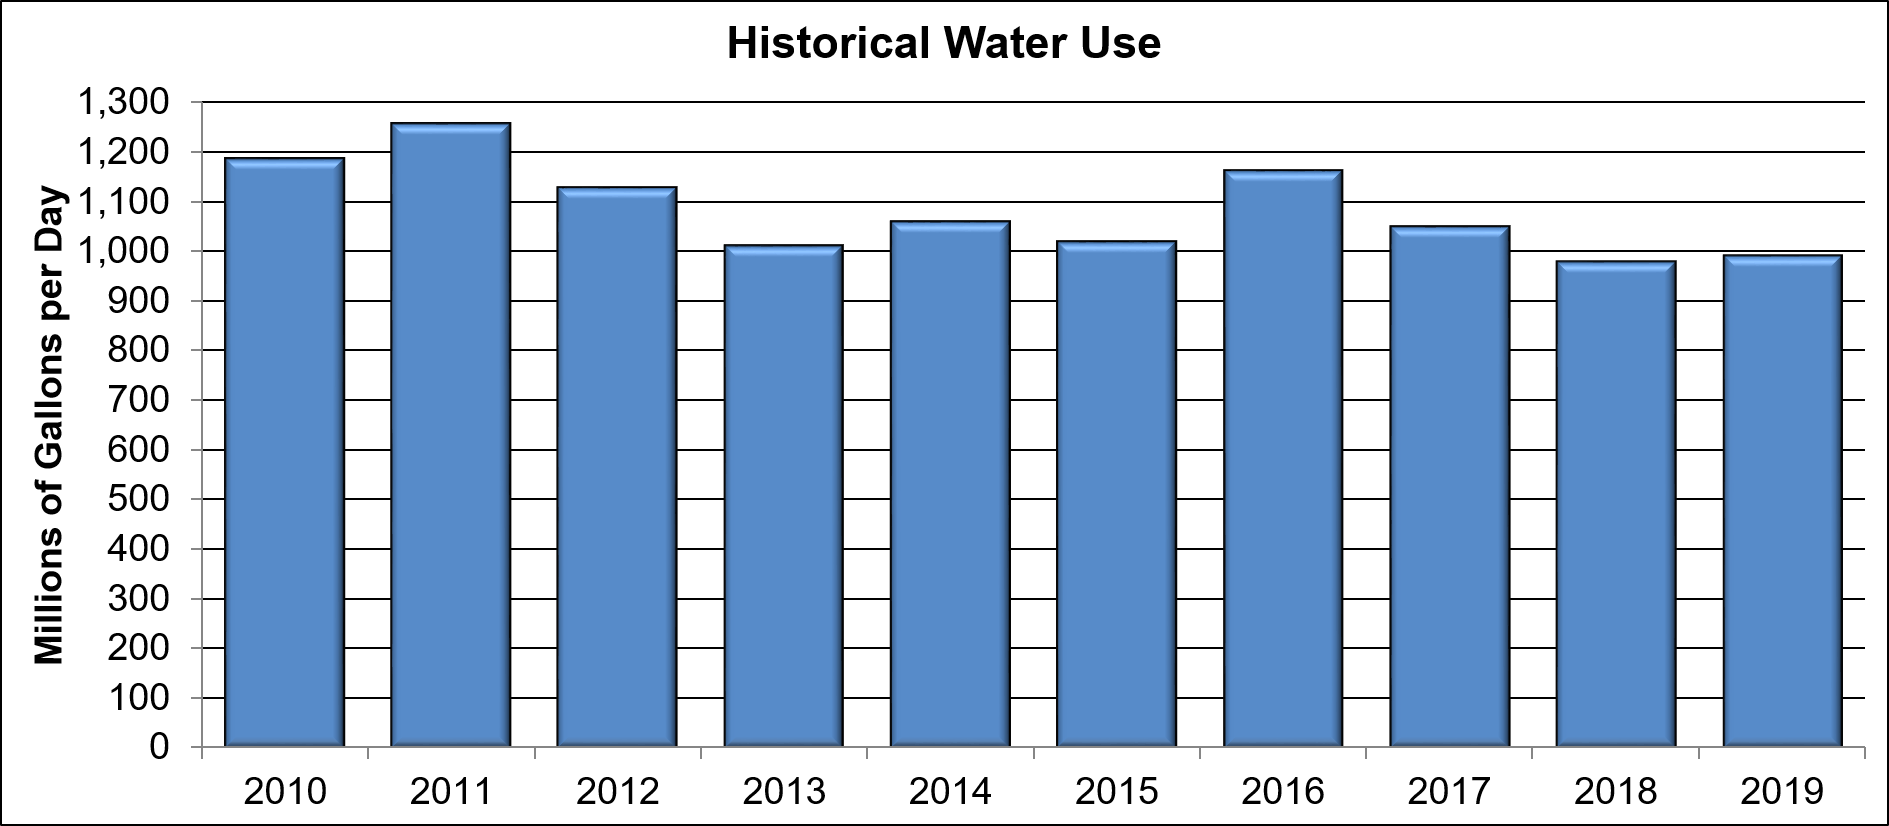 PALATKA, Fla., July 17, 2020 — Annual water use reporting conducted by the St. Johns River Water Management District shows that 2019 total water use was 9 percent below the 10-year average, even while total population continued to increase by 11 percent over the last decade. The District’s 2019 Survey of Annual Water Use was presented at the District’s July Governing Board meeting on Tuesday.
“The study results remind all of us to keep doing our part to conserve water in our homes and businesses,” said St. Johns River Water Management District Executive Director Dr. Ann Shortelle. “Turning off the faucet while brushing your teeth, installing water-efficient appliances and fixtures, following our Water Less advice and letting Mother Nature water your lawn are just a few examples of what each of us can contribute.”
Within the St. Johns District, the largest water use is public supply, which represents 55 percent of the total water use, followed by agricultural irrigation at 20 percent and commercial/industrial/institutional and mining/dewatering uses at 9 percent of water use.
Highlights of the report include:
- Total public supply water use in 2019 was 545 million gallons per day (mgd), which was approximately 4 percent lower than public water use in 2018. This includes some commercial/industrial/institutional uses that are supplied by public supply utilities.
- Gross per capita water use decreased to 116 gallons per person per day (gpcd), down from 128 gpcd in 2018. Gross per capita includes all public supply uses.
- More than 217 mgd of reclaimed water is used within the St. Johns District, or about 57 percent of the wastewater flow. Reclaimed water is treated wastewater that is reused for beneficial purposes and reduces the demand for fresh groundwater for irrigation and some industrial and commercial uses.
- Total water use increased by 1 percent from 2018 (980 mgd) to 2019 (986 mgd).
- Agricultural water use was 32 percent below the 10-year average though slightly higher than 2018. The increase is attributed to continued hurricane recovery and the effects of citrus greening.
- Self-supplied commercial/industrial/institutional and mining/dewatering water use remained relatively stable compared to 2018.
- Total population Districtwide has increased by 11 percent during the 10-year period, an increase of 800,000 people to more than 5.5 million people. Since 2018, total population has increased by 5.7 percent.
Factors such as water conservation, less landscape irrigation with potable water and increases in multifamily housing occupancy can decrease gross per capita rates. Conversely, expanded tourism and other commercial development, larger irrigated lots and increases in single family housing can increase gross per capita rates.
The District has published annual water use data since 1978. Annual water use surveys assess total water use, with data arranged by source, category of use, and county. Water use amounts are based on the best available data at the time of publication. The published report can be found on the District’s website here.