
Dry weather trend continued in January
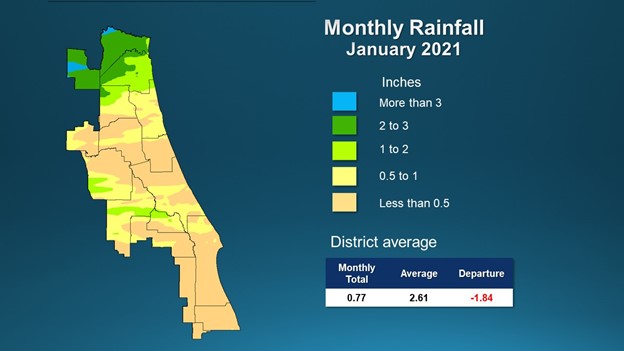
A map illustrates rainfall conditions in January across the St. Johns River Water Management District

A map illustrates rainfall conditions in January across the St. Johns River Water Management District
APOPKA, Fla., Feb. 9, 2021 — A dry weather trend continued across most of the St. Johns River Water Management District in January, with eight counties receiving less than a half-inch of rainfall over the month.
A full report outlining January’s hydrologic conditions was presented at the St. Johns River Water Management District’s Governing Board meeting Tuesday.
Highlights include:
Rainfall
- Districtwide, January rainfall averaged 0.77 inches, which is 1.84 inches below the long-term average for the month.
- Eight of the District’s 18 counties received less than a half-inch of rain. Indian River County was the driest, receiving just 0.08 inch.
- Nassau County received the most rain, 2.8 inches.
- Districtwide, the cumulative rainfall total over the last 12 months is 49.88 inches, which is 1.1 inches below the long-term average.
- Despite the low amount of rainfall in January, most areas are maintaining average or near average cumulative rainfall totals for the past 12 months. County totals range from 45.4 inches for St. Johns County to 55 inches for Volusia County.
- NOAA predicts below-average rainfall for the next three months, with likely development of drought conditions. Now is a good time to start training lawns and landscapes to use less water. Visit WaterLessFlorida.com for tips to help landscapes thrive while saving water and money.
Groundwater
- Upper Floridan aquifer conditions (groundwater levels) at the end of January were in the normal range across much of the District, with some zones still in the high range. However, many monitoring wells are trending downward.
- Groundwater levels are at the 74th percentile Districtwide. This means that since 1980, aquifer levels have been higher than they are now about 26 percent of the time.
Surface water flows
- Surface water flows in the St. Johns River and its tributaries and the St. Marys River were average for the time of year.
- Flow in the headwaters at the Melbourne station was 116 million gallons per day (mgd), which is in the 40th percentile of flow conditions for this time of year.
- Further downstream, the St. Johns River DeLand station reported flows of 1.6 billion gallons per day (bgd), which is in the 56th percentile of flow conditions for this time of year, while the Satsuma station reported flows of 3.7 bgd (66th percentile).
- Flow in the Econlockhatchee River near Chuluota was 60 mgd (44th percentile).
- Flows in the Wekiva River near Sanford were 153 mgd (33rd percentile).
- Flows in the Ocklawaha River, the largest tributary to the St. Johns River, were in the average range at 450 mgd (29th percentile).
- Flows in the St. Marys River near Macclenny were in the average range at 237 mgd (53rd percentile).
Lake levels
- Lake Brooklyn water levels decreased 0.5 feet in January to 98.9 feet, remaining below its long-term average.
- Lake Weir, at 52.9 feet, decreased 0.1 feet.
- Lake Apopka’s water level did not fluctuate significantly and is consistent with its regulation schedule. Lake Apopka is part of a system with water control structures that are operated by the District to reduce flood impacts, and the lake level is regulated according to a specific schedule.
- Blue Cypress Lake levels dropped 0.4 feet to 22.6 feet and is currently below its regulation schedule. Blue Cypress Lake is also part of a system with water control structures that are operated by the District.
Spring flows
- The mean monthly flow at Silver Springs decreased to 654 cubic feet per second (cfs), or 423.
- At the Blue Spring station in Volusia County, the mean monthly flow increased to 180 cfs, or 116 mgd, which is within the high flow range for the time of year.
- At Rock Springs, the monthly mean flow decreased 2 cfs but was still in the high ranges for the time of year. The flows were 62 cfs (40 mgd).
- Mean monthly flow at Wekiwa Springs decreased 2 cfs to 70 cfs (45 mgd).
To learn more about rainfall totals and other hydrologic data collected, visit sjrwmd.com.
Follow the water conservation conversation at #sjrwmd #waterconservation #savewater.