
Unusually wet April benefits water levels
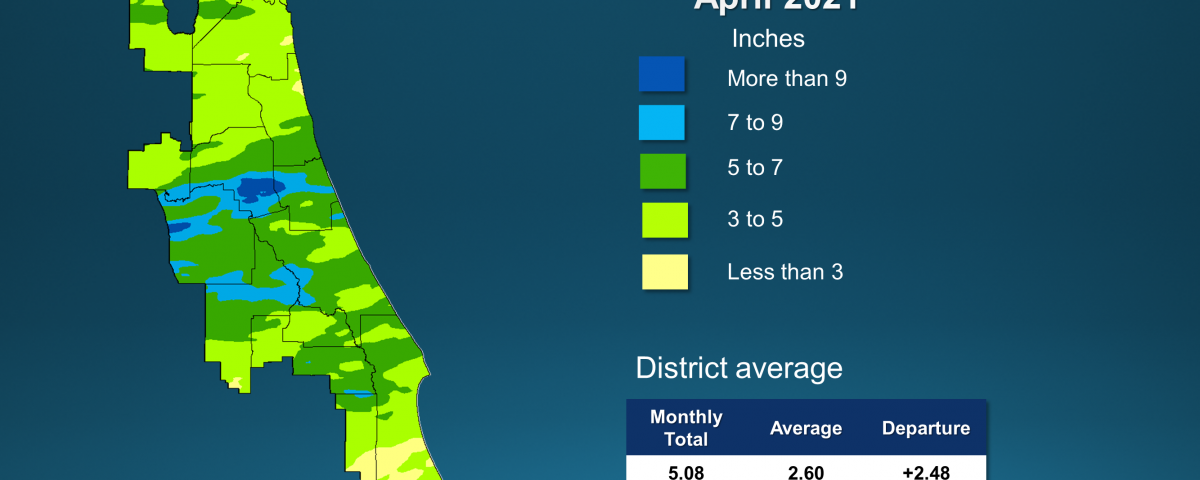
A map illustrates rainfall conditions in April across the St. Johns River Water Management District.
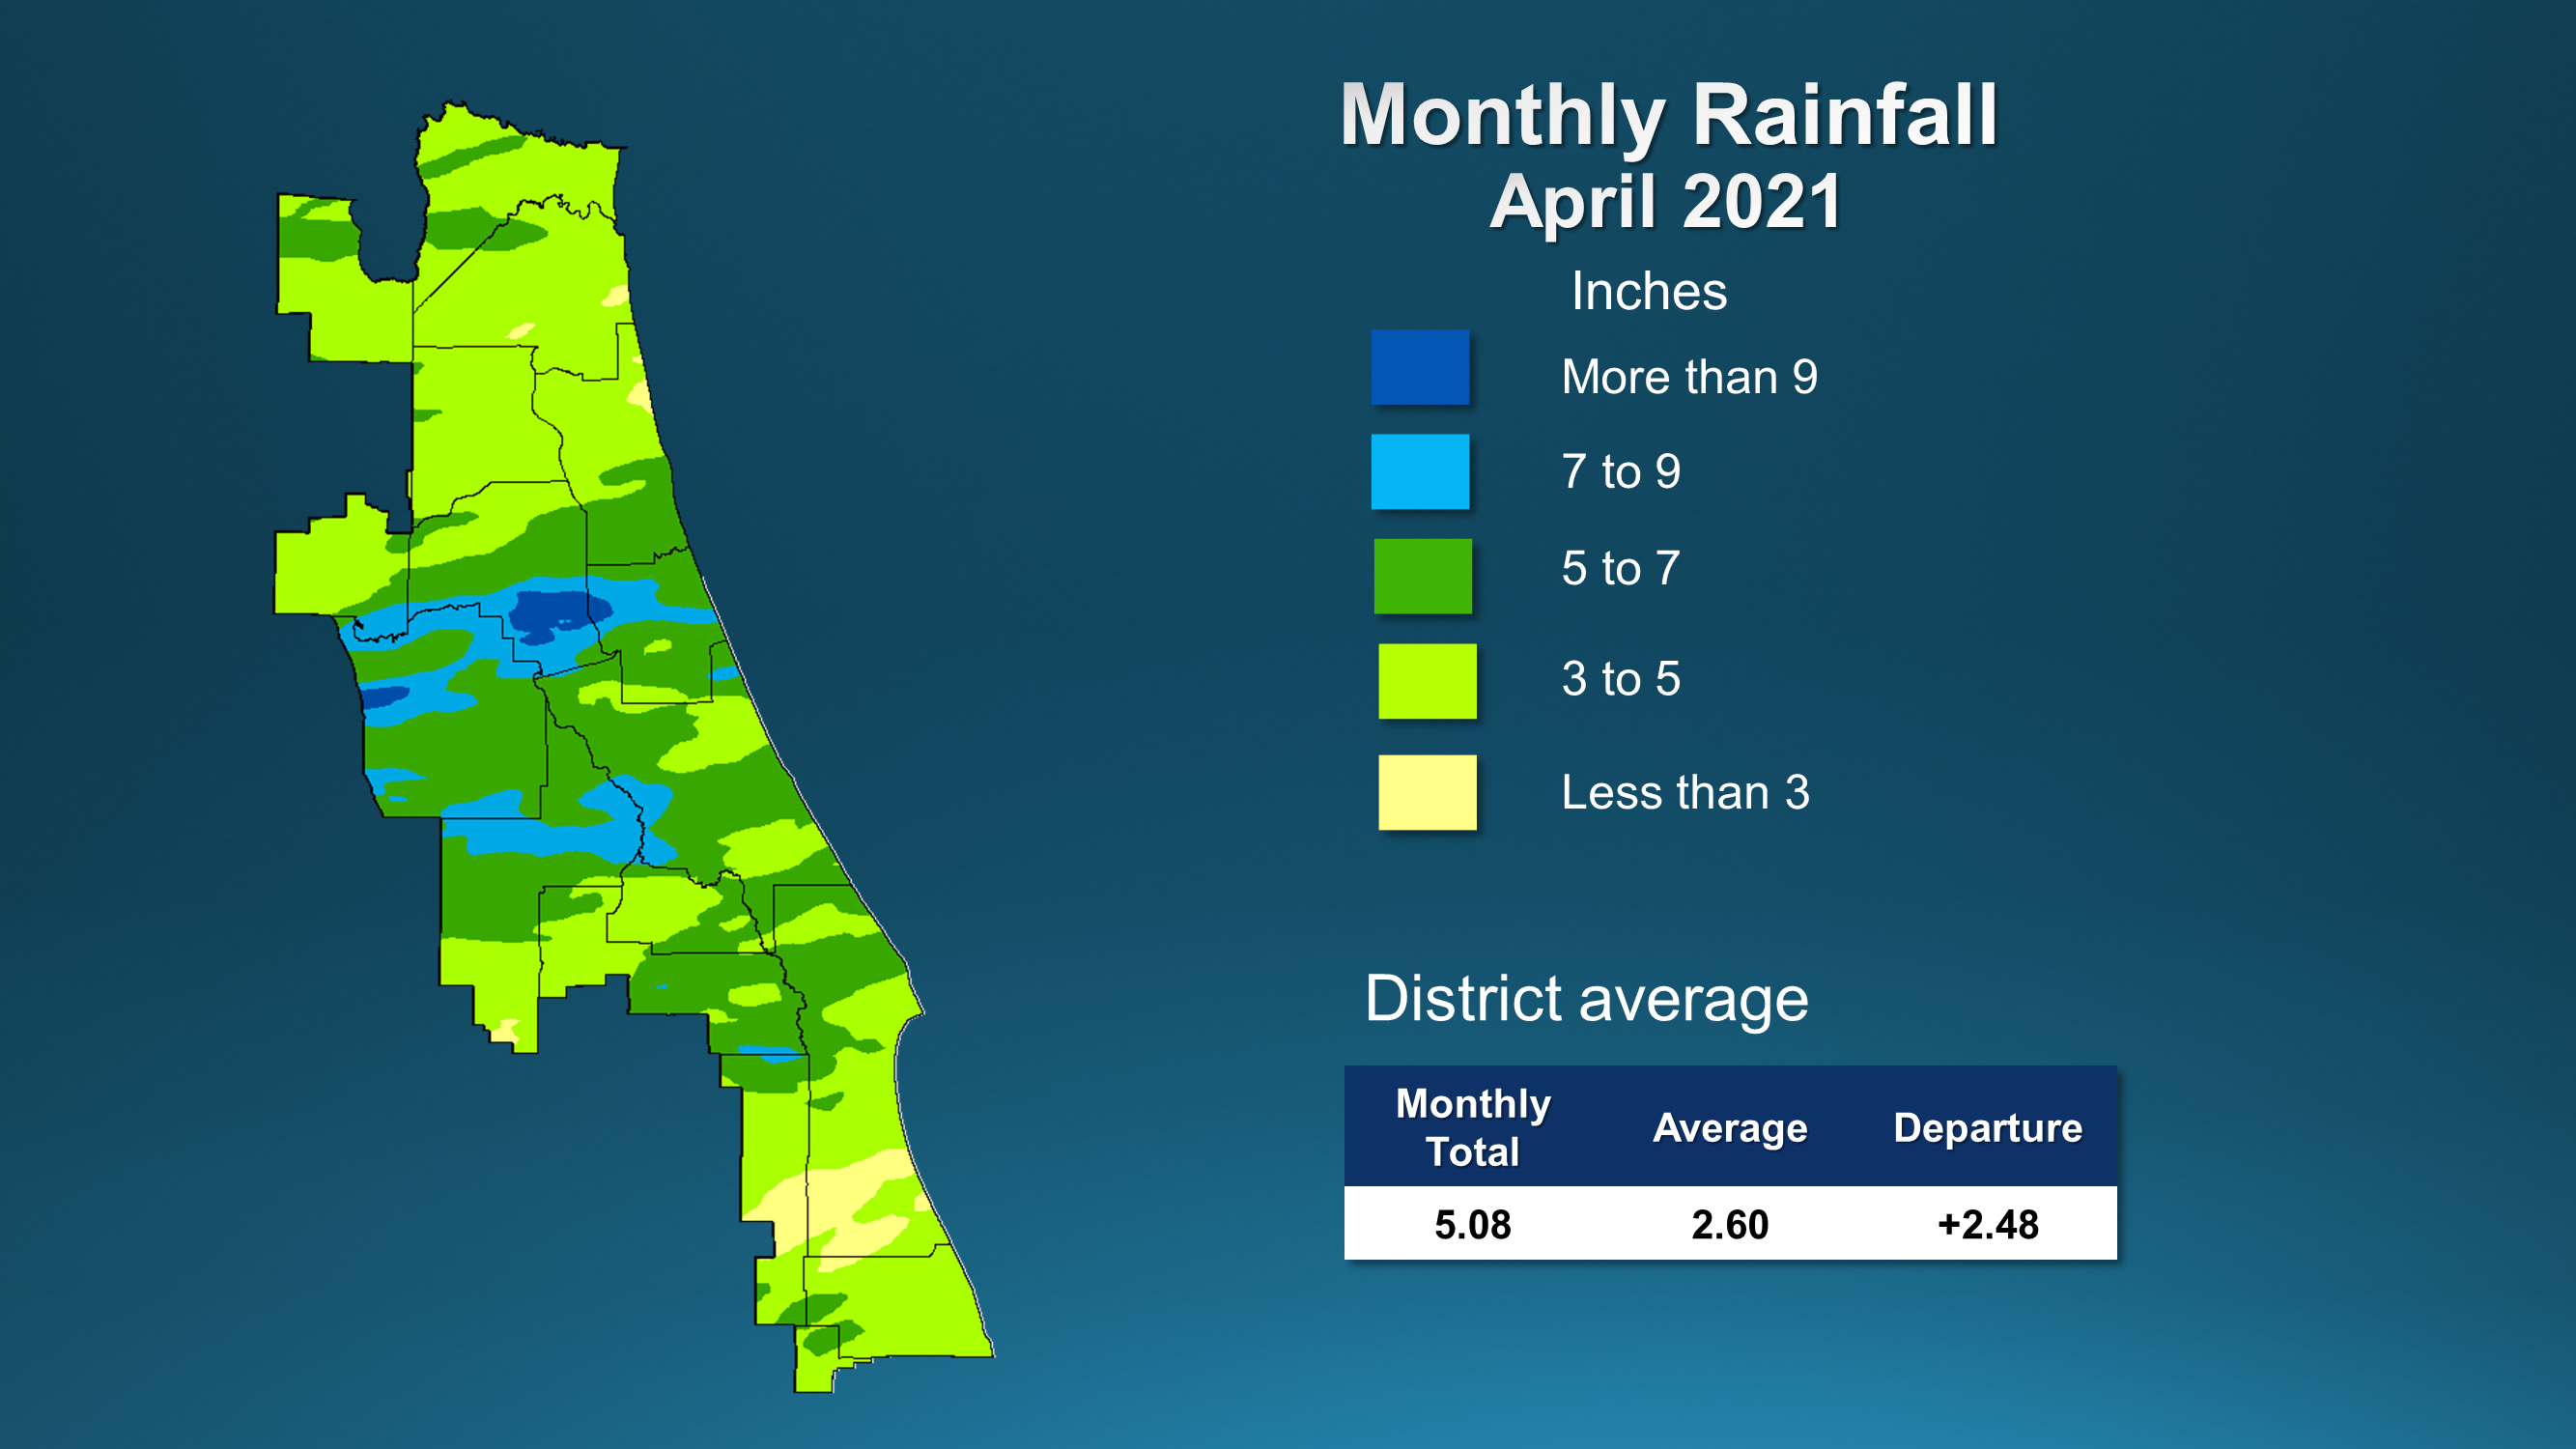
A map illustrates rainfall conditions in April across the St. Johns River Water Management District.
PALATKA, Fla., May 11, 2021 — While April is usually one of Florida’s drier months, above-average rainfall last month across the St. Johns River Water Management District benefited water levels in the Floridan aquifer.
Highlights of the full report outlining April’s hydrologic conditions include:
Rainfall
- Districtwide, April rainfall averaged 5.1 inches, which is nearly 2.5 inches above the long-term average for the month.
- April rainfall was above average across the District — and in some areas, well above average, including parts of south Putnam and Marion counties that received more than 9 inches of rain
- Countywide totals ranged from 3.7 inches in Duval County to more than 6 inches for Flagler, Putnam and Marion counties.
- Districtwide, the cumulative total for the past 12 months was near or above the long-term average, at 54.25 inches.
- Countywide totals for the past 12 months range from 51.1 inches in Lake County to 58.9 inches in Volusia County.
Groundwater
- Upper Floridan aquifer conditions (groundwater levels) at the end of April were in the normal range across the District, except for the north and northwest regions of the District.
- Water levels in monitor wells in northeast St. Johns and southeast Duval counties decreased more than 10 percentile points compared to the previous month, while many central area wells increased more than 10 points.
- Groundwater levels are at the 63rd percentile Districtwide. This means that since 1980, aquifer levels have been higher than they are now about 37 percent of the time.
Surface water flows
- Surface water flow conditions in most of the St. Johns River mainstem was in the normal range except for the headwaters station in Melbourne, which was in the low range, and the Lower St. Johns River Basin station at Satsuma, which was in the very high range.
- Orlando tributary flows varied from low ranges in the Wekiva River to high in the Econlockhatchee River.
- On May 1, flow in the St. Johns River’s headwaters at the Melbourne station was 20 million gallons per day (mgd), which corresponds to the 19th
- Flow at the Deland station was 1.3 billion gallons per day (bgd) (72nd percentile).
- Flow at the Satsuma station was very high at 4.2 bgd (93rd percentile).
- Flow in the Econlockhatchee River near Chuluota was high at 96 mgd (86th percentile).
- Flows in the Wekiva River near Sanford were low at 121 mgd (20th percentile).
- Flows in the Ocklawaha River, the largest tributary to the St. Johns River, were in the high range at 726 mgd (80th percentile).
- Flows in the St. Marys River near Macclenny were in the high range at 324 mgd (84th percentile).
Lake levels
- Lake Brooklyn water levels decreased 0.4 feet in April to 98.9 feet.
- Lake Weir, at 53 feet, increased 0.2 feet.
- Lake Apopka’s water level did not fluctuate significantly and remained consistent with its regulation schedule at 65.9 feet. Lake Apopka is part of a system with water control structures that are operated by the District to reduce flood impacts, and the lake level is regulated according to a specific schedule.
- Blue Cypress Lake levels began and ended the month at roughly the same level. Blue Cypress is also part of a system with water control structures that are operated by the District. During April and May, the regulation schedule levels begin to drop in preparation for the summer wet season.
Spring flows
- The mean monthly flow at Silver Springs decreased to 618 cubic feet per second (cfs), or 399 mgd, which is in the normal range for this time of year.
- At the Blue Spring station in Volusia County, the mean monthly flow increased slightly to 166 cfs, or 107 mgd, which is in the high flow range for this time of year
- At Rock Springs, the monthly mean flow decreased 1 cfs to 59 cfs (38 mgd), which is in the high range.
- Mean monthly flow at Wekiwa Springs decreased 2 cfs to 68 cfs (44 mgd), which is in the high range for the time of year.
To learn more about rainfall totals and other hydrologic data collected, visit sjrwmd.com.
Visit www.WaterLessFlorida.com for tips to help landscapes thrive while saving water and money. Follow the water conservation conversation at #sjrwmd #waterconservation #savewater.