
Rainfall in May was well below average Districtwide
A map illustrates rainfall conditions in May across the St. Johns River Water Management District.
A map illustrates rainfall conditions in May across the St. Johns River Water Management District.
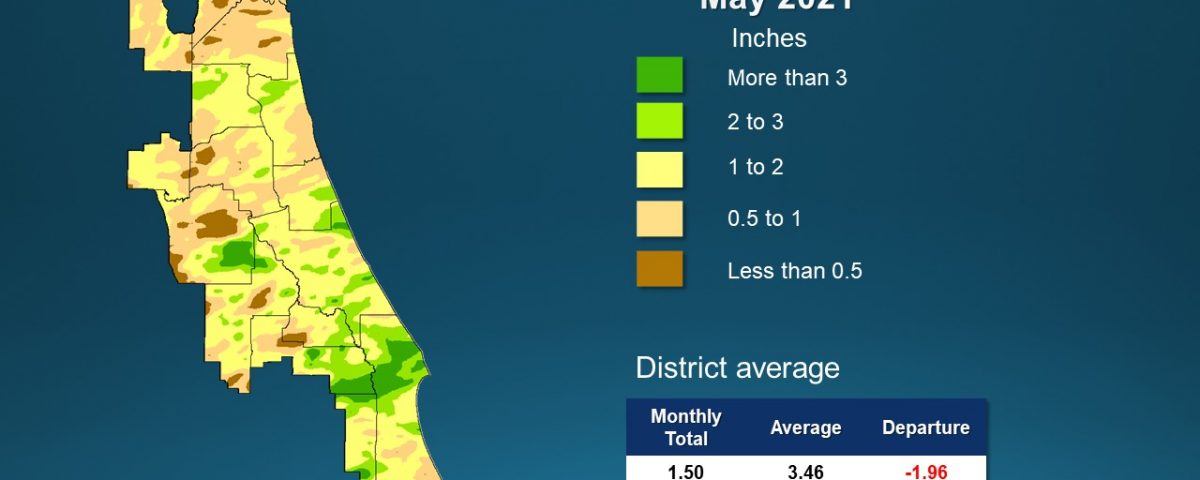
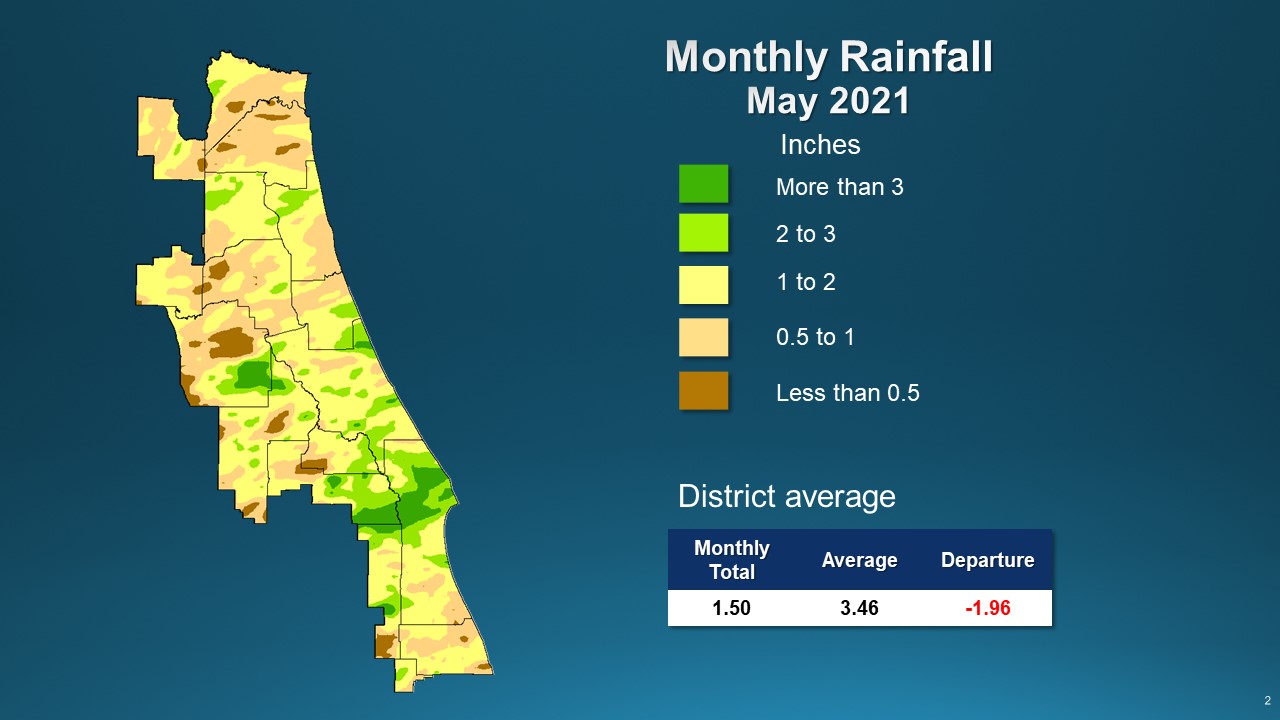
PALATKA, Fla., June 8, 2021 — May rainfall was well below average across the St. Johns River Water Management District, with only a few areas of near-average rainfall in southeast Orange, northern Brevard and southeast Marion counties.
A full report outlining May’s hydrologic conditions was presented at the District’s Governing Board meeting Tuesday. Highlights include:
Rainfall
- Districtwide, May rainfall averaged 1.5 inches, which is 1.96 inches below the long-term average for the month.
- May rainfall was well below average across the District, with countywide totals ranging from 0.9 inch in Baker County to 2.1 inches in Brevard County.
- Districtwide, the cumulative total for the past 12 months is near the long-term average, at 51.9 inches.
- Countywide rainfall totals for the past 12 months range from 51.1 inches in Lake County to 58.9 inches in Volusia County.
Groundwater
- Upper Floridan aquifer conditions (groundwater levels) at the end of May were mostly in the normal range but significant low range zones were recorded in Indian River and southern Brevard counties, southeastern Duval and northern St. Johns counties and in scattered pockets throughout central Florida.
- Groundwater levels are at the 40th percentile Districtwide. This means that since 1980, aquifer levels have been higher than they are now about 60 percent of the time.
Surface water flows
- Surface water flow conditions in the St. Johns River headwaters were in the very low range, while the rest of the upper and middle St. Johns River basins’ stations were in the average range.
- On June 1, flow in the St. Johns River’s headwaters at the Melbourne station were negative, or reverse flow, at -5 million gallons per day (mgd), which corresponds to the 3rd
- Orlando tributary flows varied from the very low range in the Wekiva River to average in the Econlockhatchee River.
- Flows in the Econlockhatchee River near Chuluota were in the average range at 27 mgd (42nd percentile).
- Flows in the Wekiva River near Sanford were very low at 101 mgd (6th percentile).
- Flows at the Deland station were 460 mgd (27th percentile).
- Flow in the Lower St. Johns River Basin was in the very low range, while the Ocklawaha River was average.
- Flows in the Ocklawaha River, the largest tributary to the St. Johns River, were in the average range at 439 mgd (28th percentile).
- Flows at the Satsuma station were negative, -2,650 mgd, or in th.e 5th.
- Flows in the St. Marys River near Macclenny were in the average range at 40 mgd (57th percentile).
Lake levels
- Lake Brooklyn water levels decreased a foot in May to 97.8 feet.
- Lake Weir, at 52.5 feet, decreased a half-foot.
- Lake Apopka’s water level decreased about a half-foot and remained consistent with its regulation schedule at 65.3 feet. Lake Apopka is part of a system with water control structures that are operated by the District to reduce flood impacts, and the lake level is regulated according to a specific schedule.
- Blue Cypress Lake levels decreased 0.8 foot, matching the regulation schedule for the time of year as the rainy season approaches. Blue Cypress is also part of a system with water control structures that are operated by the District. During April and May, the regulation schedule levels begin to drop in preparation for the summer wet season.
Spring flows
- The mean monthly flow at Silver Springs increased to 633 cubic feet per second (cfs), or 409 mgd.
- At the Blue Spring station in Volusia County, the mean monthly flow increased slightly to 175 cfs, or 113 mgd, which is in the high flow range for this time of year.
- At Rock Springs, the monthly mean flow decreased slightly to 58 cfs (37 mgd), which is in the normal range.
- Mean monthly flow at Wekiwa Springs decreased slightly to 66 cfs (43 mgd), which is in the normal range for the time of year.
To learn more about rainfall totals and other hydrologic data collected, visit sjrwmd.com.
Visit www.WaterLessFlorida.com for tips to help landscapes thrive while saving water and money. Watch the weather and wait to water during Florida’s summer rainy season. Follow the water conservation conversation at #sjrwmd #waterconservation #savewater.