
Above-average June rainfall brings up lake levels
A map illustrates rainfall conditions in May across the St. Johns River Water Management District.
Tropical Storm Elsa made wet areas wetter
PALATKA, Fla., July 13, 2021 — In a word, June was wet — and in some areas, extremely wet. The western edge of the St. Johns River Water Management District recorded more than 10 inches of rain in June, even before Tropical Storm Elsa made landfall on Florida’s northern Gulf Coast on July 7.
A map illustrates rainfall conditions in May across the St. Johns River Water Management District.
A full report outlining June’s hydrologic conditions was presented at the District’s Governing Board meeting Tuesday. Highlights include:
Rainfall
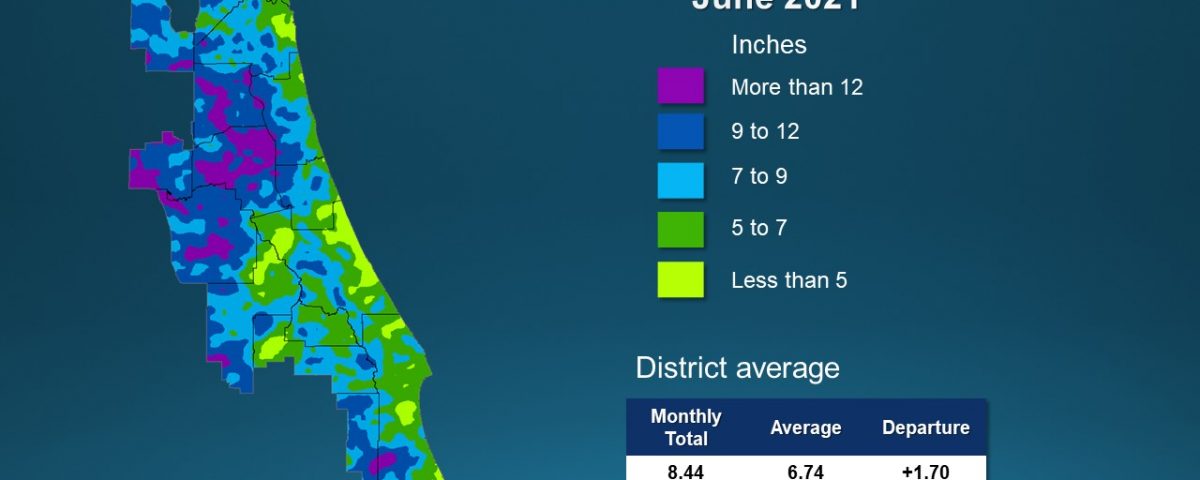
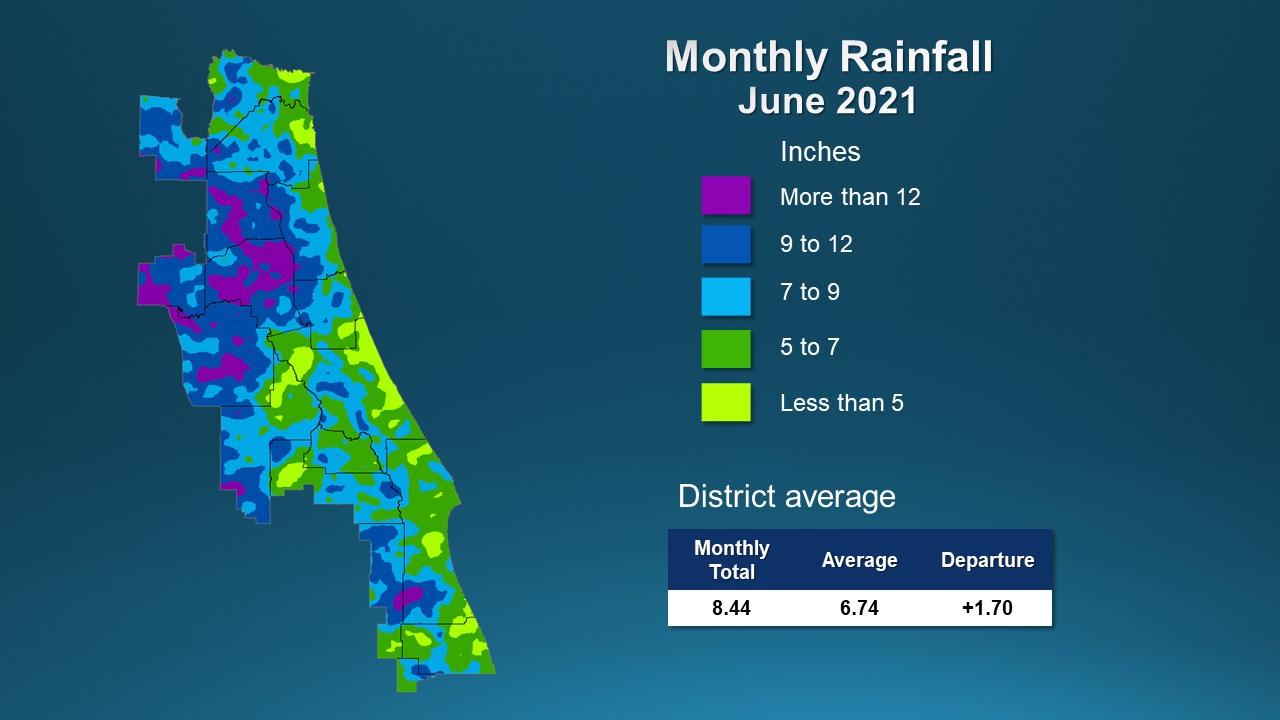
- Districtwide, June rainfall averaged 8.44 inches, which is 1.70 inches above the long-term average for the month.
- June rainfall was above average across the much of the District, although several counties in the coastal zone and central Florida reported average or below-average rainfall.
- Tropical Storm Elsa brought additional rainfall in early July to the already very wet northwest region, but southern and central coastal areas are still dry.
- Counties with the highest rainfall totals were Putnam and Alachua, with more than 11 inches of rain, followed by Clay and Marion counties which received between 10 and 11 inches.
- Counties with slightly below-average rainfall in June included Seminole, Volusia and Indian River.
- Districtwide, the cumulative rainfall total for the past 12 months is 52.85 inches, which is 1.84 inches above the long-term average.
- Countywide rainfall totals for the past 12 months range from 49 inches in Osceola County to 56.4 inches in Putnam County.
Groundwater
- Upper Floridan aquifer conditions (groundwater levels) at the end of June were mostly in the normal range, other than a few pockets of low-range areas including the coastal area of southeast Duval/northeast St. Johns counties.
- Groundwater levels are at the 55th percentile Districtwide and trending upward, which is common for this time of year. This means that since 1980, aquifer levels have been higher than they currently are about 45 percent of the time.
Surface water flows
- Surface water flow conditions in all the St. Johns River stations were in the average range.
- On July 1, flow in the St. Johns River’s headwaters at the Melbourne station was 320 million gallons per day (mgd) (62nd percentile).
- Flows in the Econlockhatchee River near Chuluota were in the average range at 253 mgd (67th percentile).
- Flows in the Wekiva River near Sanford were in the average range at 164 mgd (40th percentile).
- Flows at the Deland station were in the average range at 1.3 billion gallons per day (bgd) (25th percentile).
- Flows in the Ocklawaha River, the largest tributary to the St. Johns River, were in the high range at 1.1 bgd (89th percentile).
- Flows at the Satsuma station were average range at 4 bgd (67th percentile).
- Flows in the St. Marys River near Macclenny were in the very high range at 842 mgd (93rd percentile).
Lake levels
- Lake Brooklyn water levels increased 0.6 foot to 98.4 feet in June.
- Lake Weir increased by 0.5 foot to 53 feet.
- Lake Apopka’s water level increased 0.2 foot to 65.5 feet and remained consistent with its regulation schedule. Lake Apopka is part of a system with water control structures that are operated by the District to reduce flood impacts, and the lake level is regulated according to a specific schedule.
- Blue Cypress Lake levels increased 0.1 foot to 21.3 feet, matching the regulation schedule for the time of year. Blue Cypress is also part of a system with water control structures that are operated by the District. During April and May, the regulation schedule levels begin to drop in preparation for the summer wet season.
Spring flows
- The mean monthly flow at Silver Springs decreased to 596 cubic feet per second (cfs), or 385 mgd, which is in the normal range.
- At the Blue Spring station in Volusia County, the mean monthly flow decreased to 162 cfs, or 105 mgd, which is in the normal or high range for this time of year
- At Rock Springs, the monthly mean flow decreased slightly to 58 cfs (38 mgd), which is in the normal or high range for June.
- Mean monthly flow at Wekiwa Springs decreased slightly to 65 cfs (42 mgd), which is in the normal range for the time of year.
To learn more about rainfall totals and other hydrologic data collected, visit sjrwmd.com.
Visit www.WaterLessFlorida.com for tips to help landscapes thrive while saving water and money. Watch the weather and wait to water during Florida’s summer rainy season. Follow the water conservation conversation at #sjrwmd #waterconservation #savewater.