
Aquifer levels are rising, thanks to July rains
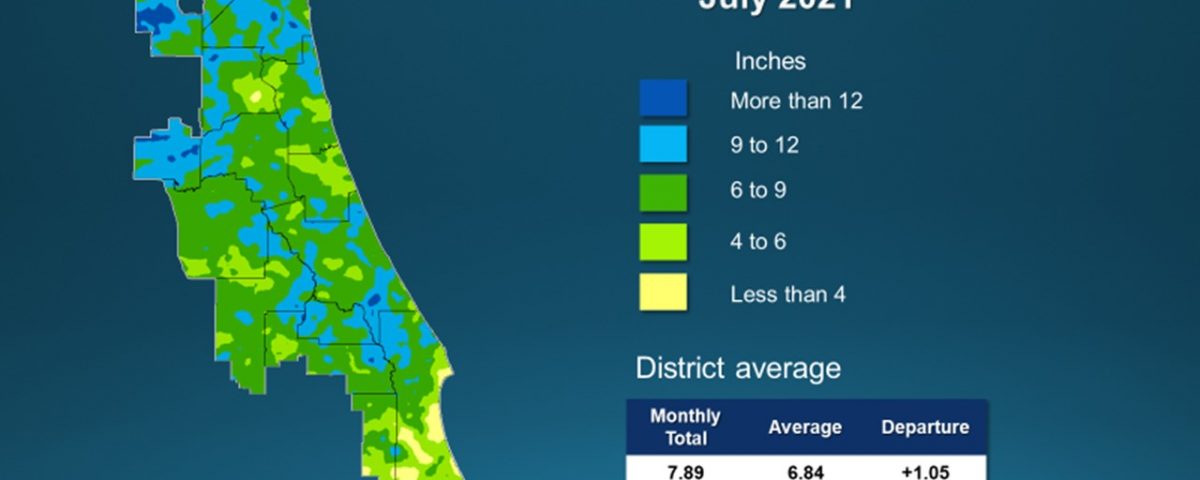
A map illustrates rainfall conditions in July across the St. Johns River Water Management District.
PALATKA, Fla., Aug. 10, 2021 — July started with Tropical Storm Elsa making landfall on Florida’s northern Gulf Coast, bringing rainy conditions to the St. Johns River Water Management District, and the month wrapped up with above-average rainfall across the District except for its two southernmost counties.

A map illustrates rainfall conditions in July across the St. Johns River Water Management District.
A full report outlining July’s hydrologic conditions was presented at the District’s Governing Board meeting Tuesday. Highlights include:
Rainfall
- Districtwide, July rainfall averaged 7.89 inches, which is 1.05 inches above the long-term average for the month.
- Counties with the highest rainfall totals are Alachua, with 10.7 inches of rain, followed by Baker, Nassau and Seminole counties, which all received between nine and 10 inches.
- The county with the least rainfall in July was Indian River, with 5.4 inches. Portions of southern Brevard were also drier.
- Districtwide, the cumulative rainfall total for the past 12 months is 53.65 inches, which is 2.64 inches above the long-term average.
- Countywide rainfall totals for the past 12 months range from a high of 59.25 inches in Alachua County to a low of 48 inches in Osceola County.
Groundwater
- Upper Floridan aquifer conditions (groundwater levels) at the end of July were mostly in the normal range, but a large zone of high levels was recorded along the western side of the District and in southern Volusia/northern Brevard counties. In many monitoring wells used for the monthly report, water levels increased more than 10 percentile points in July.
- Groundwater levels are at the 73rd percentile Districtwide. This means that since 1980, aquifer levels have been higher than they currently are about 27 percent of the time.
Surface water flows
- Surface water flow in Upper St. Johns River stations and the Econlockhatchee River station was in the average range, while flow in the Orlando area at the Wekiva River and the Middle St. Johns River station near DeLand was high.
- On Aug. 1, flow in the St. Johns River’s headwaters at the Melbourne station was 355 million gallons per day (mgd) (57th percentile).
- Flows in the Econlockhatchee River near Chuluota were in the average range at 184 mgd (54th percentile).
- Flows in the Wekiva River near Sanford were in the high range at 317 mgd (87th percentile).
- Flows at the DeLand station were in the high range at 2.9 billion gallons per day (bgd) (77th percentile).
- Flows in the Ocklawaha River, the largest tributary to the St. Johns River, were in the average range at 802 mgd (64th percentile).
- Flows at the Satsuma station were very high range at 8 bgd (92nd percentile).
- Flows in the St. Marys River near Macclenny were in the very high range at more than 1 bgd (94th percentile).
Lake levels
- Lake Brooklyn water levels increased 1.26 feet to 99.6 feet in July.
- Lake Weir increased by 0.3 foot to 53.3 feet.
- Lake Apopka’s water level increased 0.2 foot to 65.7 feet and are being maintained at its regulation schedule. Lake Apopka is part of a system with water control structures that are operated by the District to reduce flood impacts, and the lake level is regulated according to a specific schedule.
- Blue Cypress Lake levels increased slightly to 21.4 feet, matching the regulation schedule for the time of year. Blue Cypress is also part of a system with water control structures that are operated by the District. During April and May, the regulation schedule levels begin to drop in preparation for the summer wet season.
Spring flows
- The mean monthly flow at Silver Springs increased to 657 cubic feet per second (cfs), or 425 mgd, which is a 61 cfs increase from June.
- At the Blue Spring station in Volusia County, the mean monthly flow decreased to 134 cfs, or 86 mgd, briefly dropping into the very low range.
- At Rock Springs, the monthly mean flow increased 4 cfs to 62 cfs (40 mgd), which is in the high range for July.
- Mean monthly flow at Wekiwa Springs increased slightly to 66 cfs (43 mgd), which is in the normal range for the time of year.
To learn more about rainfall totals and other hydrologic data collected, visit sjrwmd.com.
Visit www.WaterLessFlorida.com for tips to help landscapes thrive while saving water and money. Watch the weather and wait to water during Florida’s summer rainy season. Follow the water conservation conversation at #sjrwmd #waterconservation #savewater.