
Despite wet conditions, August rainfall slightly below average
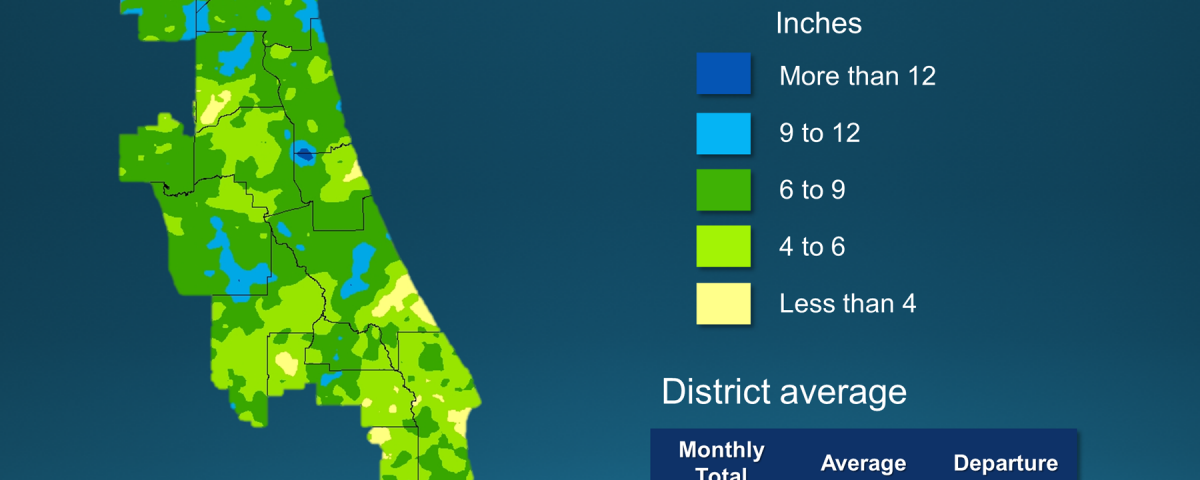
A map illustrates rainfall conditions in August across the St. Johns River Water Management District.
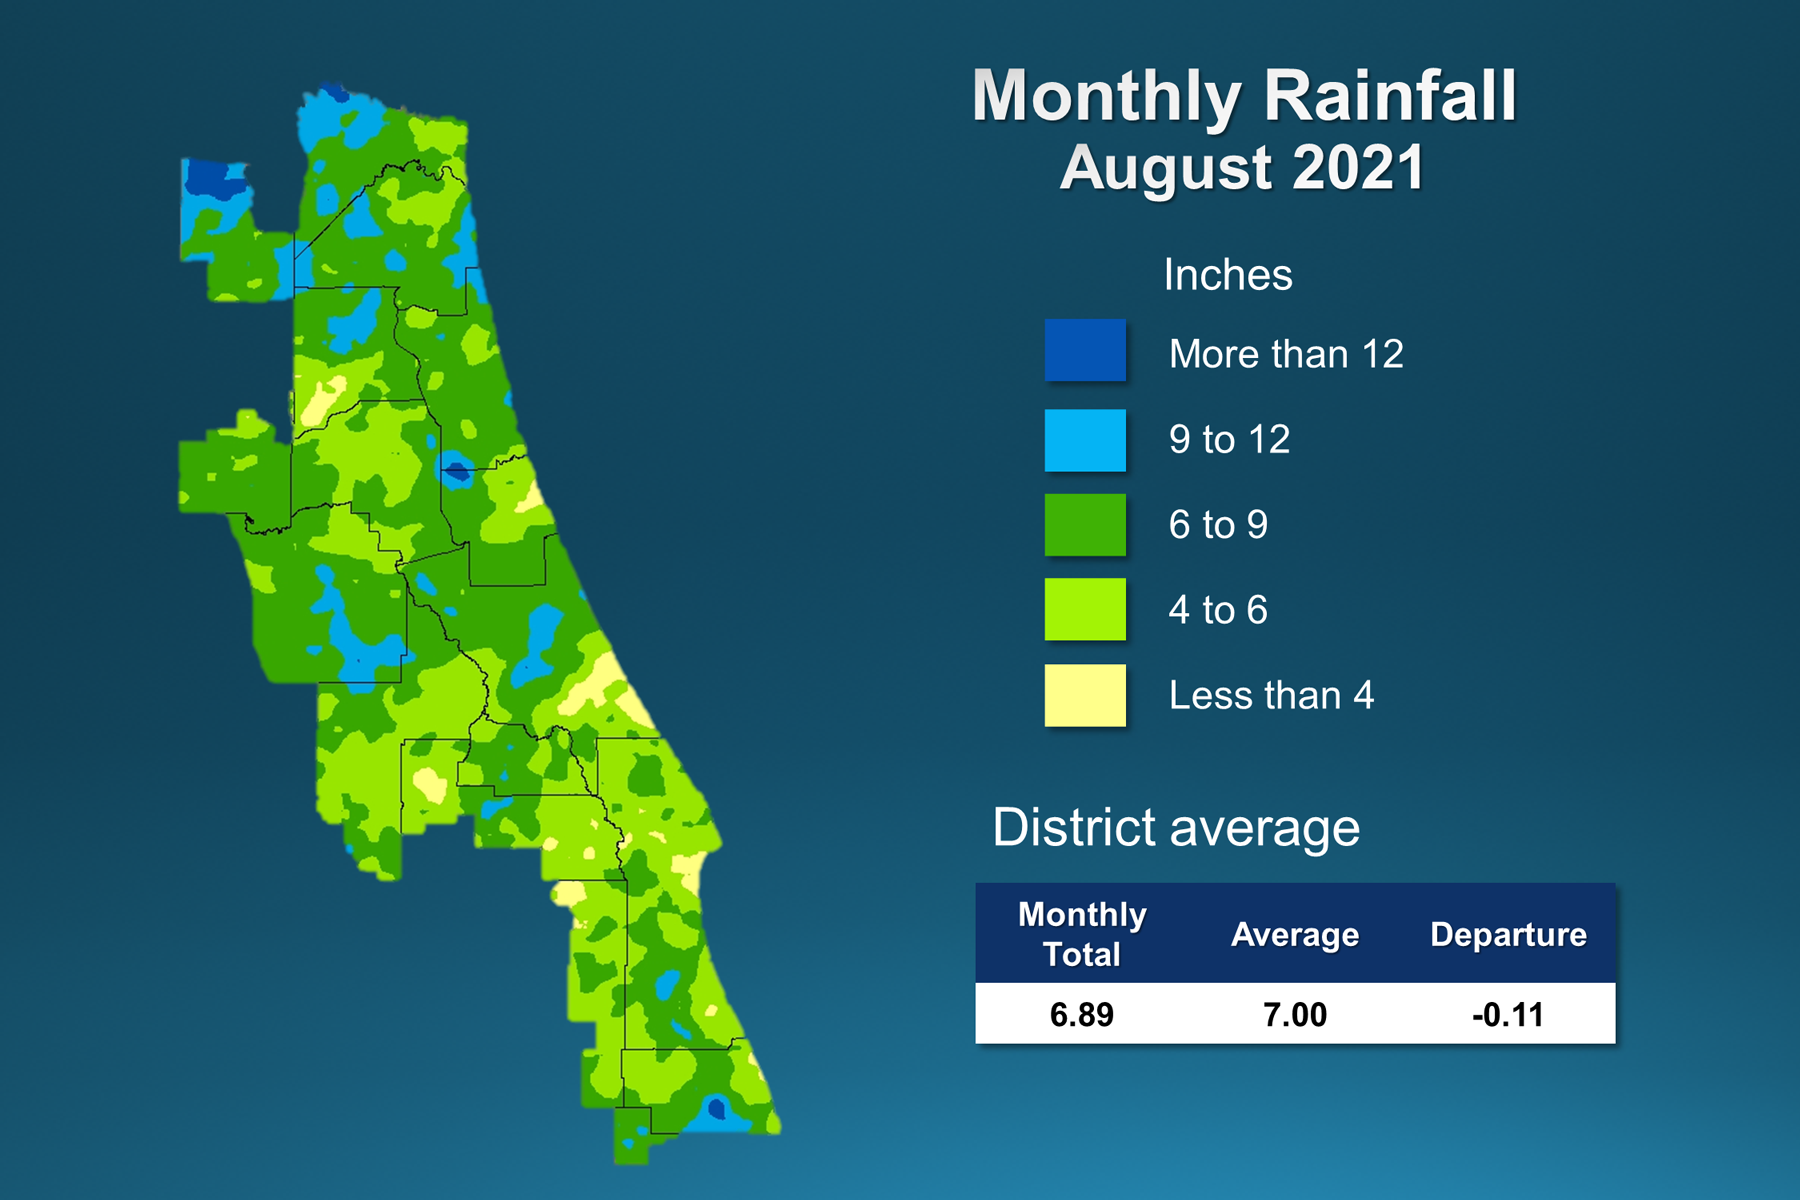
A map illustrates rainfall conditions in August across the St. Johns River Water Management District.
PALATKA, Fla., Aug. 10, 2021 — August is typically the wettest month of the year, bringing rainy conditions to the St. Johns River Water Management District. The month wrapped up with rainfall slightly below the long-term average.
A full report outlining August’s hydrologic conditions was presented at the District’s Governing Board meeting Tuesday. Highlights include:
Rainfall
- Districtwide, August rainfall averaged 6.89 inches, which is 0.11 inches below the long-term average for the month.
- Counties with the highest rainfall totals are Baker, with 9.2 inches of rain, followed by Nassau and Marion counties, which both received over 8 inches.
- The counties with the least rainfall in August were Orange County with 5.5 inches, and Osceola County with 5.15 inches.
- Districtwide, the cumulative rainfall total for the past 12 months is 52.8 inches, which is 1.83 inches above the long-term average.
- Countywide rainfall totals for the past 12 months range from a high of 57.9” for Alachua to a low of 45.7” for Osceola.
Groundwater
- Upper Floridan aquifer conditions (groundwater levels) at the end of August were either in the high or normal range throughout the District. Water levels in many of the wells used for this report increased more than 10 percentile points during the month.
- Groundwater levels are at the 83rd percentile Districtwide. This means that since 1980, aquifer levels have been higher than they currently are about 17 percent of the time.
Surface water flows
- On Sept. 1, flow in most stations across the District was in the average range. The two exceptions were the St. Marys River, which had flow in the High range, and the tidal St. Johns River at Jacksonville station which exhibited very high flow on Sept. 1.
- On Sept. 1, flow in the St. Johns River’s headwaters at the Melbourne station was 530 million gallons per day (mgd) (51st percentile).
- Flows in the Econlockhatchee River near Chuluota were in the average range at 156 mgd (44th percentile).
- Flows in the Wekiva River near Sanford were in the average range at 217 mgd (67th percentile).
- Flows at the DeLand station were in the average range at 2.8 billion gallons per day (bgd) (59th percentile).
- Flows in the Ocklawaha River, the largest tributary to the St. Johns River, were in the average range at 659 mgd (52nd percentile).
- Flows at the St. Johns River near Satsuma station were in the average range at 7 bgd (72nd percentile).
- Flows in the St. Marys River near Macclenny were in the high range at more than 717 mgd (80th percentile).
Lake levels
- Lake Brooklyn water levels increased 0.7 foot to 100.3 feet in August.
- Lake Weir increased by 0.4 foot to 53.7 feet.
- Lake Apopka’s water levels did not increase. Water levels remain 65.7 feet. Lake Apopka’s water levels are being maintained at its regulation schedule. Lake Apopka is part of a system with water control structures that are operated by the District to reduce flood impacts, and the lake level is regulated according to a specific schedule.
- Blue Cypress Lake levels increased slightly to 21.8 feet, matching the regulation schedule for the time of year. Blue Cypress is also part of a system with water control structures that are operated by the District. During April and May, the regulation schedule levels begin to drop in preparation for the summer wet season.
Spring flows
- The mean monthly flow at Silver Springs increased to 762 cubic feet per second (cfs), or 493 mgd, which is a 105 cfs increase from July’s mean.
- At the Blue Spring station in Volusia County, the mean monthly flow was 136 cfs, or 88 mgd.
- At Rock Springs, the monthly mean flow increased 2 cfs to 64 cfs (42 mgd), which is in the high range for August.
- Mean monthly flow at Wekiwa Springs increased slightly to 68 cfs (44 mgd), which is in the normal range for the time of year.
To learn more about rainfall totals and other hydrologic data collected, visit sjrwmd.com.
Visit www.WaterLessFlorida.com for tips to help landscapes thrive while saving water and money. Watch the weather and wait to water during Florida’s summer rainy season. Follow the water conservation conversation at #sjrwmd #waterconservation #savewater.