

Rainfall divides the District in November
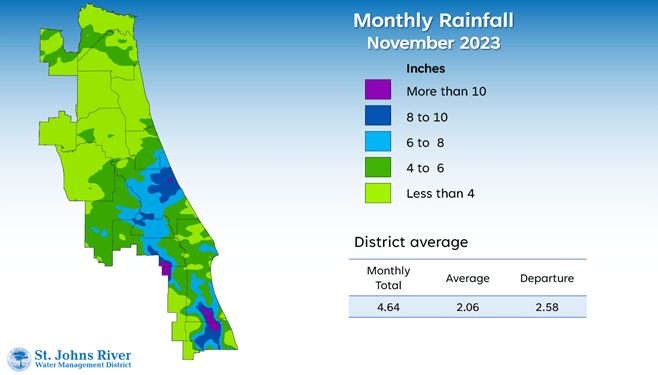
A map illustrates rainfall conditions in November across the St. Johns River Water Management District.
PALATKA, Fla., Dec. 12, 2023 — November, typically known for its dry weather, took an unexpected turn this year, bringing an unusual amount of rainfall to the southern half of the St. Johns River Water Management District. The majority of the rainfall occurred on Nov. 16 with areas in Brevard, Indian River, Osceola and Orange counties receiving 12 inches or more.

A map illustrates rainfall conditions in November across the St. Johns River Water Management District.
Additionally, the central Florida corridor stretching from Orlando to Daytona experienced abnormally high rainfall amounts, measuring approximately three times higher than the monthly average. A full report outlining November’s hydrologic conditions was presented at the District’s Governing Board meeting Dec. 12. Highlights include:
Rainfall
- Districtwide, November’s rainfall averaged 4.64 inches, doubling the typical monthly average.
- Over the past 12 months, rainfall remains slightly below average in most of the District, except for portions of St. Johns, Volusia and Indian River counties, which were all above average.
- Districtwide, the cumulative rainfall total for the past 12 months is 49.85 inches, 1.16 inches below the long-term average.
- County-wide totals ranged from 45.3 inches in Nassau County to 55.5 inches in Volusia County.
Groundwater
- Upper Floridan aquifer conditions were a mix of mostly high or normal range at the end of November, except for some small areas in Duval County, where conditions were in the low range.
- Districtwide groundwater levels, expressed as a single index, fall within the 55th percentile, considered normal for this time of year.
Spring flows
- Silver Springs recorded a mean monthly flow of 608 cubic feet per second (cfs), or 393 million gallons per day (mgd), within the normal range for this period.
- Blue Spring station in Volusia County reported a mean monthly flow of 160 cfs, or 104 mgd, also within the normal range.
- Rock Springs experienced a slight decrease in mean monthly flow yet remained in the normal range at 58 cfs (38 mgd).
- Wekiwa Springs also exhibited a slight decrease, recording a mean monthly flow of 63 cfs (41 mgd), consistent with the normal range for this time of year.
To learn more about rainfall totals and other hydrologic data collected, visit www.sjrwmd.com.
Visit WaterLessFlorida.com for tips to help landscapes thrive while saving water and money. Follow the water conservation conversation at #sjrwmd #waterconservation #savewater.