Rainfall patterns vary across District in July

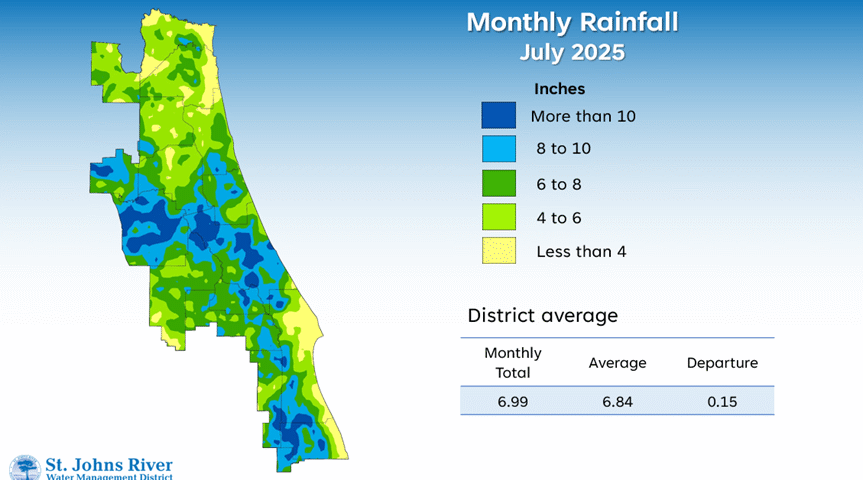
A map illustrates rainfall conditions in July across the St. Johns River Water Management District.

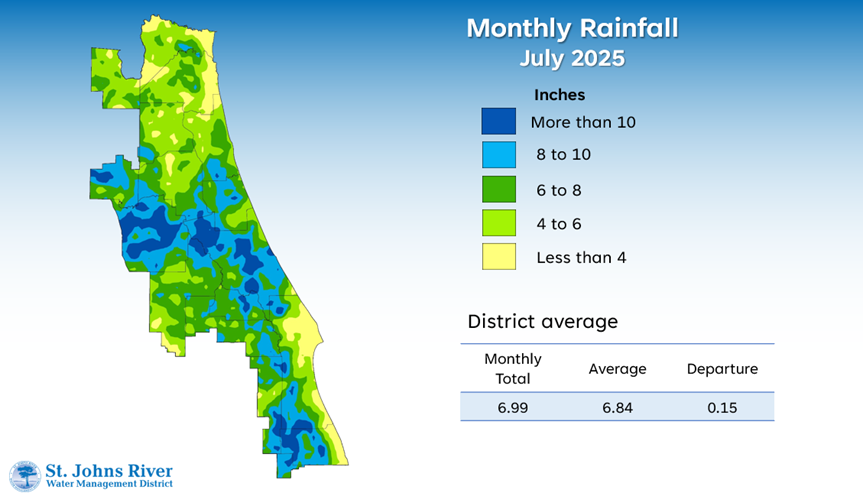
A map illustrates rainfall conditions in July across the St. Johns River Water Management District.
Rainfall across the District in July was slightly above the monthly average, with 9 of 18 counties recording above-average totals. Ten counties exceeded their 12-month averages, while three were more than 2 inches below. Precipitation varied widely, delivered by summer thunderstorms and frontal systems, including Invest 93L, which crossed the District in mid-July. Central counties such as Marion and Volusia, along with parts of northern Brevard and Indian River counties, saw the highest amounts, with some areas receiving more than 11 inches. In contrast, northern counties and southern coastal areas saw lower totals.
A full report outlining July’s hydrologic conditions was presented at the District’s Governing Board meeting. Highlights include:
Rainfall
· Districtwide rainfall averaged 6.99 inches, which is 0.15 inches above the monthly average.
· Totals ranged from 9.56 inches in Marion County to 4.98 inches in Nassau County.
· Annual rainfall across the District was 53.64 inches, 2.63 inches above the long-term average.
· Northern and central counties continue to receive the most rainfall throughout the year, while areas along the southern coast and western portions of the District have received less.
· Ten counties have recorded above normal annual rainfall, with five counties more than 4 inches above their annual average, including Seminole and Volusia counties which are more than 10 inches above average. Eight counties are below their 12-month average, with Baker and Bradford counties more than 3 inches below normal.
Groundwater
· Water levels across the Upper Floridan Aquifer primarily increased in July, with a larger portion of the area now in the normal range.
· Districtwide groundwater levels, expressed as a single index, were in the 51st percentile, which is in the normal range for this time of year.
Spring flows
· Silver Springs recorded a monthly mean flow of 527 cubic feet per second (cfs), or 341 million gallons per day (mgd), a decrease of 12 cfs from June. This is in the normal range for this time of year.
· In Volusia County, the Blue Spring station reported an increase of 20 cfs in July with a monthly mean flow of 180 cfs (116 mgd).
· Rock Springs had a monthly mean flow of 59 cfs (39 mgd), remaining in the high range.
· Wekiwa Springs recorded a monthly mean flow of 64 cfs (41 mgd) continuing to be in the normal range.
For further insights into rainfall totals and other hydrologic data, visit sjrwmd.com.
Visit WaterLessFlorida.com for tips to help landscapes thrive while saving water and money. Follow the water conservation conversation at #sjrwmd #waterconservation #savewater.

