
Below-average rainfall continues across District for sixth consecutive month
at
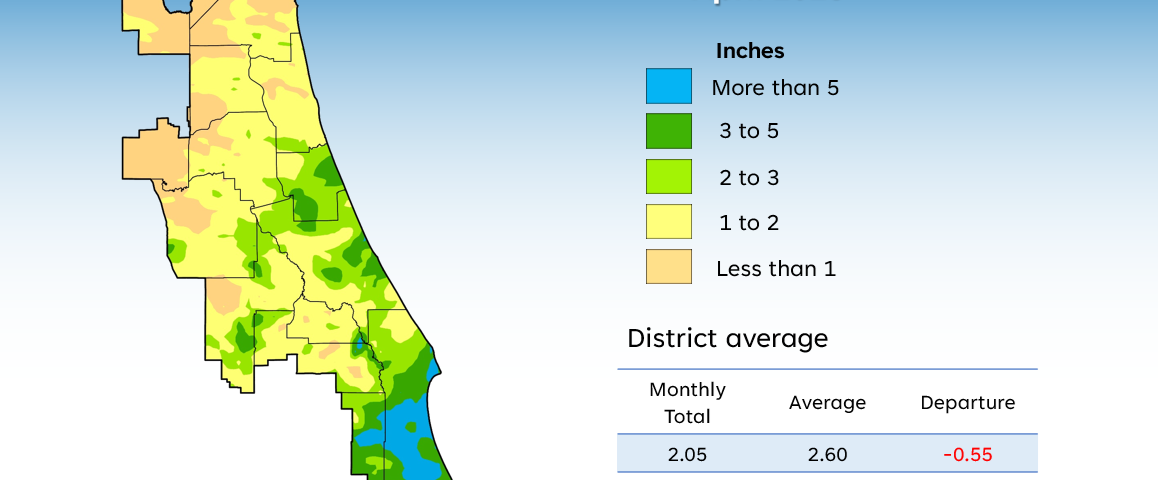
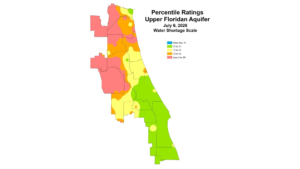
A map illustrates rainfall conditions in April across the St. Johns River Water Management District.