
District monitoring and data inform action for water protection
June 17, 2021

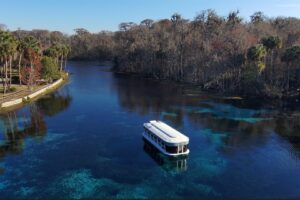
A District water quality monitoring site on the Silver River.
Data touches every facet of the St. Johns River Water Management District’s work and provide the foundation for making sound decisions to benefit Florida’s water resources.
As an environmental regulatory agency, data and science are the foundation of our work. Data drives the agency’s decisions on water supply projects, protecting the health of surface water bodies and groundwater, managing flood control structures and issuing consumptive use permits. We also share the valuable information we collect with many partners, including the Florida Department of Environmental Protection (such as through the Statewide Water Quality Database known as WIN), other agencies and local governments.
You may have seen our staff working with various high-tech and low-tech gadgets from a boat on the St. Johns River, logging statistics about aquatic vegetation in the Indian River Lagoon or out in a field recording information at a mini weather station. Their monitoring work is a major component of our mission, resulting in more than nearly 15.5 million measurements collected, verified, processed and stored in our databases each year. Year-round, the District operates and maintains 1,200 hydrologic surface and groundwater monitoring stations throughout our 18 counties. Staff also process data from additional sites collected by federal agencies, other Districts and local governments or the U.S. Geological Survey under contract to the District. Staff also collect and process data from more than 400 surface water stations and more than 450 groundwater monitoring sites.
This month, we launched an enhanced a web portal making these data easier to access. The upgraded site increases our transparency as a public agency and improves access to data we collect. Continuous water quality data provide a constant stream of information during all hours of the day and under a variety of weather conditions, offering a more complete picture of a water body’s health.
We even have continuous water quality six monitoring stations in the Indian River Lagoon and three in the St. Johns River. These stations transmit continuous water quality data — including information about chlorophyll, water temperature, salinity and dissolved oxygen — which the District uploads and shares on the Aquarius WebPortal at secure.sjrwmd.com/aqportal.
The data in the portal are the same data that our staff use in making long-term management decisions about our waterways. For the curious citizen-scientist, a user guide explains how to select station locations and data, display available parameters on a map, view charts of key parameters for related locations in dashboards and explore specific locations and parameters in a data set or chart.
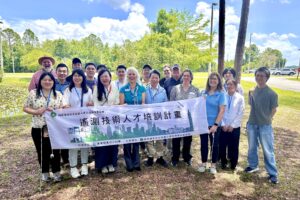
Thank you to our very dedicated staff who work in our monitoring program. Through your efforts, we continue to build on our knowledge and further protect Florida’s water resources.