
Tracking the ebb and flow of Florida’s water

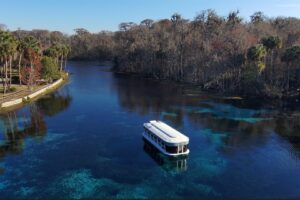
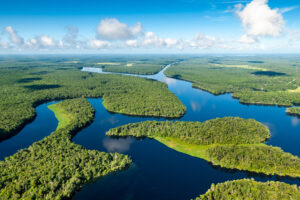
Imagine trying to track water in Florida. Consider the surge and ebb of crystalline springs; of lakes and rivers rising and receding; of infinite cycles of rainfall and drought that distinguish hydrologic seasons. Water by its very essence is ephemeral, always transitory and always on the move.
Understanding Florida’s hydrology is critical to the St. Johns River Water Management District. Information about the quality and quantity of water in the northeast and east-central Florida region drives the agency’s decisions on water supply projects, protecting the health of water bodies and groundwater, managing flood control structures, and issuing consumptive use permits.
Every day, thousands of bits of information about the region’s water — including meteorological data — trickle into the District’s Bureau of Water Resource Information (WRI).
The bureau captures the information and assimilates it in databases where it is used by the District and shared with government agencies, environmental organizations, private businesses and the general public.
“We’re in charge of tracking how much water there is in the District and the quality of that water,” says Christine Mundy, the bureau’s director. “We’re the source for data on groundwater levels, lake and river levels, river flows, rainfall and water quality in the ground and surface water.”
The scope of the bureau’s responsibilities is vast. Mundy’s staff of 70 operates and maintains more than 1,600 monitoring stations throughout the District’s 18 counties and they process data from approximately 300 additional sites collected by county and municipal agencies through mutual agreement or by the U.S. Geological Survey under contract to the District. More than 16 million measurements are collected, verified, processed and stored each year.

WRI enters the data into its databases, ensuring that the data are accurate and useable, Mundy says.
“We must have quality assurance to make sure the data are worth something,” she says. “If we’ve got poor quality data, we lose credibility. People have to be able to rely on our information.”
In some cases, monitoring stations use the magic of telemetry to transmit information on rainfall or water levels back to the District’s headquarters in Palatka. Staff also transmit data via their cell phones while collecting data in the field.
Determining the health of water, however, can also require live bodies. Jim Peterson, the Field Program Supervisor at the District’s Apopka Field Station, oversees the environmental scientists who monitor the water quality at the Lake Apopka Marsh Flow-Way, a constructed wetland hugging the northwest shore of Lake Apopka and west of the Apopka-Beauclair Canal. The District opened the flow-way in 2003 as a major component in the restoration of Lake Apopka, which had been degraded for decades by agricultural runoff.
“It’s a big commitment to come out once a week to gather samples, but we think the data are worth it,” Peterson says. “If you don’t gather samples, you don’t know which treatment cell is working best and which is dropping off.”
Lake Apopka is just one closely monitored area within his purview.
“We conduct water quality sampling and biological monitoring at the Harris Chain of Lakes, Lake Apopka and the middle basin of the St. Johns River,” Peterson says. “We have more than 100 sample sites for water quality on varying schedules with different access requirements.”

The endless cycle of collecting data is repetitive but necessary. Possessing long-term water quality data helps the District shape its management strategies for water bodies throughout the District, Peterson says.
“You can’t understand long-term trends unless you have this data,” he says. “Are lakes getting cleaner? Are management techniques working? We can look at data gathered over time and determine whether a lake is healthier if we maintain the water at a certain level for a particular duration. This information will help us with short-term management decisions and serve as a database well into the future.”
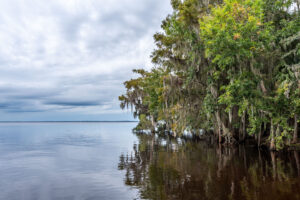
The District’s monitoring program isn’t limited to freshwater bodies. On the coast, another team led by Field Program Supervisor Tim Miller continues the mission of collecting decades of data from the Indian River Lagoon, an estuary where freshwater tributaries mix with the Atlantic saltwater carried in through several inlets.
Part of his eight-person team’s job is to gather water samples and record key information — including salinity, pH and chlorophyll — from designated sites as they’ve been doing for years. Thanks to technological advancements and funding from the Florida Department of Environmental Protection, they also installed and now maintain continuous water quality monitoring stations at six locations from Titusville to Vero Beach.
“The great attraction to the continuous monitoring stations is the added insight they provide into the complexities of the lagoon by giving us a look at how the chemistry in the water varies though the diurnal cycle. We can’t be out there sampling through the night, but the continuous monitors are out there. And in every type of weather condition too,” Miller says. “Although looking at current data can’t predict the future, the trends from the past are an incredible tool to help guide our critical decisions so that we manage well going forward.”
Of all the types of hydrologic data the District gathers, rainfall seems to generate the most interest. The District’s Hydrologic Data Collection webpage is consistently one of the most popular pages on the District’s website. The webpage includes rainfall amounts, well levels, and surface water levels and fluctuations.
“We are happy to provide information to the public, as well as to the scientists and engineers who carry out the District’s work,” Mundy says. “We have many online sources of information for hydrologic and water quality data, and if those sources aren’t helpful, we provide email addresses that the public can use to send us questions. We want the public’s investment in this high-quality data to pay off in as many ways as possible.”