September brings variable rainfall across the District – SJRWMD

September brings variable rainfall across the District

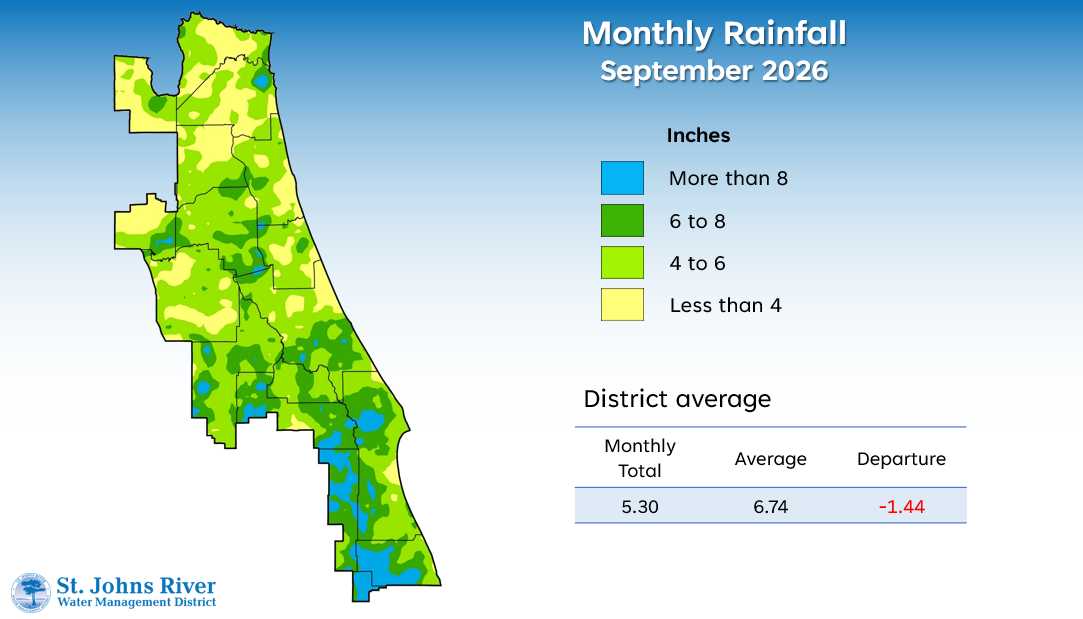
Monthly rainfall map for September 2026 in the St. Johns River Water Management District. Most areas received 4 to 8 inches of rain, with scattered locations above 8 inches. District average rainfall was 5.30 inches, which was 1.44 inches below the historical average of 6.74 inches.

A map illustrates rainfall conditions in September across the St. Johns River Water Management District.

Monthly rainfall map for September 2026 in the St. Johns River Water Management District. Most areas received 4 to 8 inches of rain, with scattered locations above 8 inches. District average rainfall was 5.30 inches, which was 1.44 inches below the historical average of 6.74 inches.
A map illustrates rainfall conditions in September across the St. Johns River Water Management District.
Below-average rainfall across much of the St. Johns River Water Management District (District) in September prolonged dry conditions in several northern and western counties, limiting the seasonal recovery typically seen at this time of year. While scattered storms delivered significant rainfall to portions of the District, precipitation was highly variable, leaving many areas with rainfall totals below normal. As a result, dry conditions persisted in counties most affected by drought within the District.

A full report outlining September’s hydrologic conditions was presented at the District’s Governing Board meeting. Highlights include:

Rainfall

  • Districtwide rainfall averaged 5.30 inches, 1.44 inches below the monthly average.
  • Monthly rainfall averages ranged from 7.82 inches in Okeechobee County to 3.19 inches in Bradford County.
  • Annual rainfall across the District was 42.07 inches, 8.94 inches below the 12-month average.
  • Rainfall totals over the past year remained uneven across the District. However, through September, all 18 counties were below their 12-month averages, with ten counties recording deficits of more than 10 inches. Of those, Baker County recorded a deficit of more than 17 inches.

Groundwater 

  • Most monitoring stations across the Upper Floridan aquifer were below the normal range at the end of September, but nearly all sites recorded improvements.
  • Districtwide groundwater levels, expressed as a single index, were in the 8th percentile for September, which is in the very low range.   

Spring flows

  • Silver Springs recorded a monthly mean flow of 400 cubic feet per second (cfs), or 258 million gallons per day (mgd), an increase of 18 cfs from August, which is in the very low range for this time of year.
  • In Volusia County, the Blue Spring station reported flows within the high range.
  • Rock Springs had a monthly mean flow of 59 cfs (38 mgd), which is in the normal range.
  • Wekiwa Springs recorded a monthly mean flow of 63 cfs (41 mgd), continuing to be in the normal range.

For further insights into rainfall totals and other hydrologic data, visit www.sjrwmd.com.  

For more information about the Phase III Extreme Water Shortage, visit www.sjrwmd.com/wateringrestrictions.

Visit WaterLessFlorida.com for tips to help landscapes thrive while saving water and money. Follow the water conservation conversation at #sjrwmd #waterconservation #savewater.